How It Works

How to use AlaryIQ from aircraft setup to engine review.

Create an aircraft, complete the profile, upload one engine-monitor flight, check the import, then use Overview, graph evidence, context, trends, and PDF reports to support a maintenance conversation.

Advisory only: AlaryIQ does not diagnose engine problems, determine airworthiness, or replace mechanic inspection, service data, or pilot judgment.
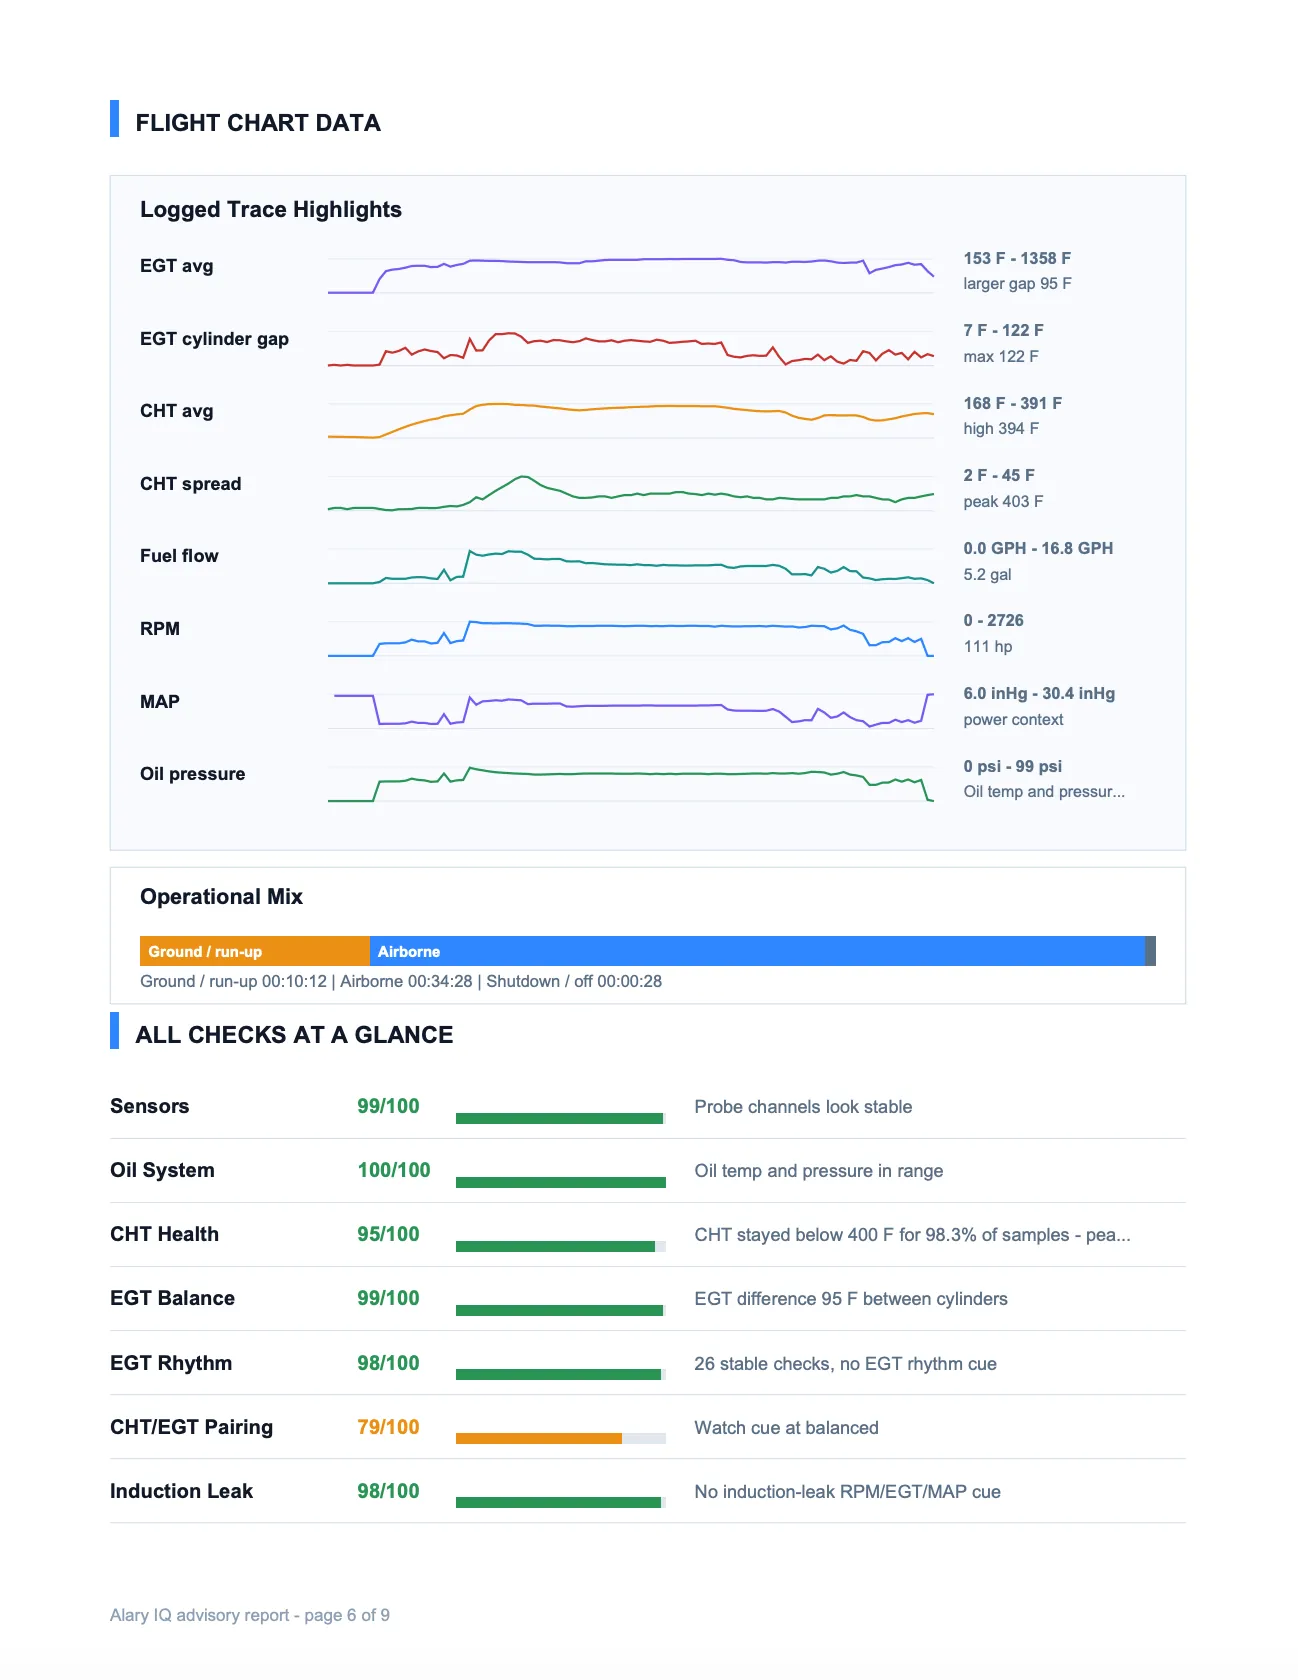
AlaryIQ Overview page with health cards, flight context, graph traces, and review details

Quick path The full workflow

Use this order for the first aircraft and first flight.

  1. 1Add aircraft
  2. 2Review settings
  3. 3Upload one flight
  4. 4Check uploads
  5. 5Flights list
  6. 6Overview
  7. 7Graph evidence
  8. 8Review context
  9. 9Cylinder detail
  10. 10Playback
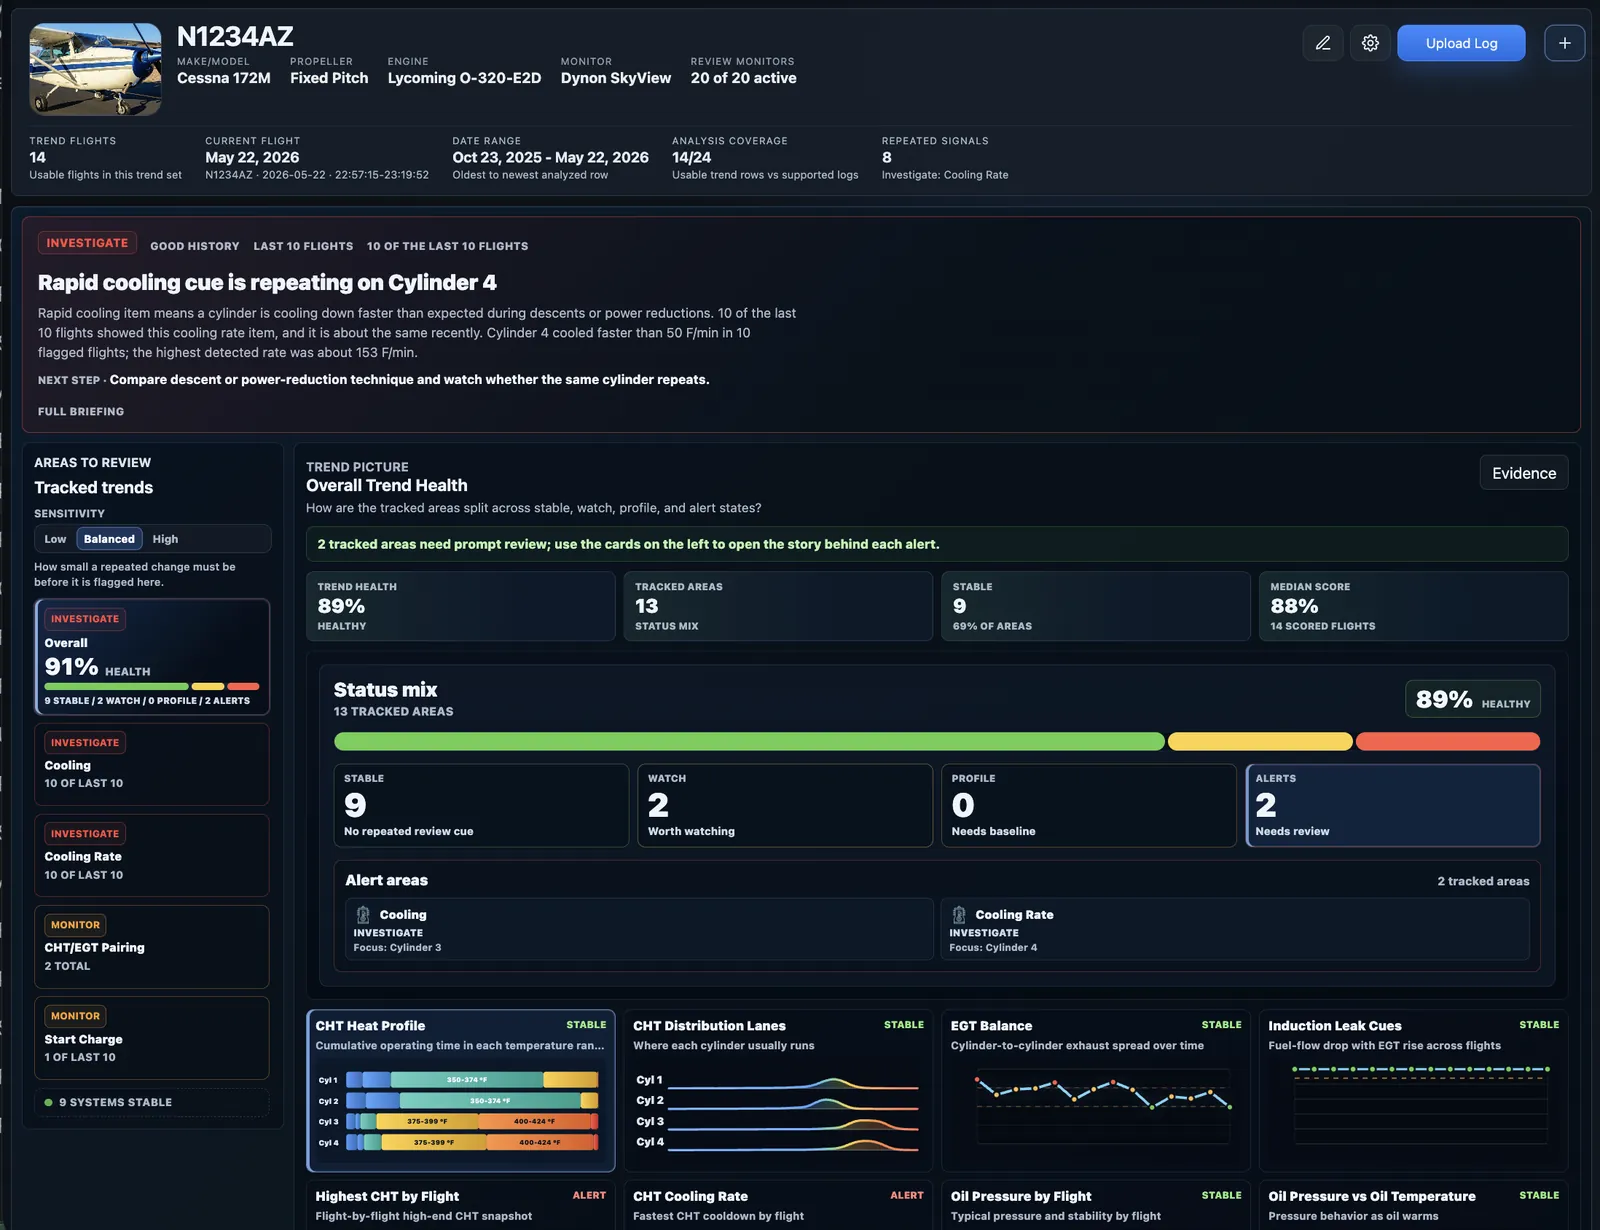
  11. 11Trends
  12. 12PDF report
  13. thenLearn to read the data
  14. thenSee worked examples
1

Add or choose an aircraft
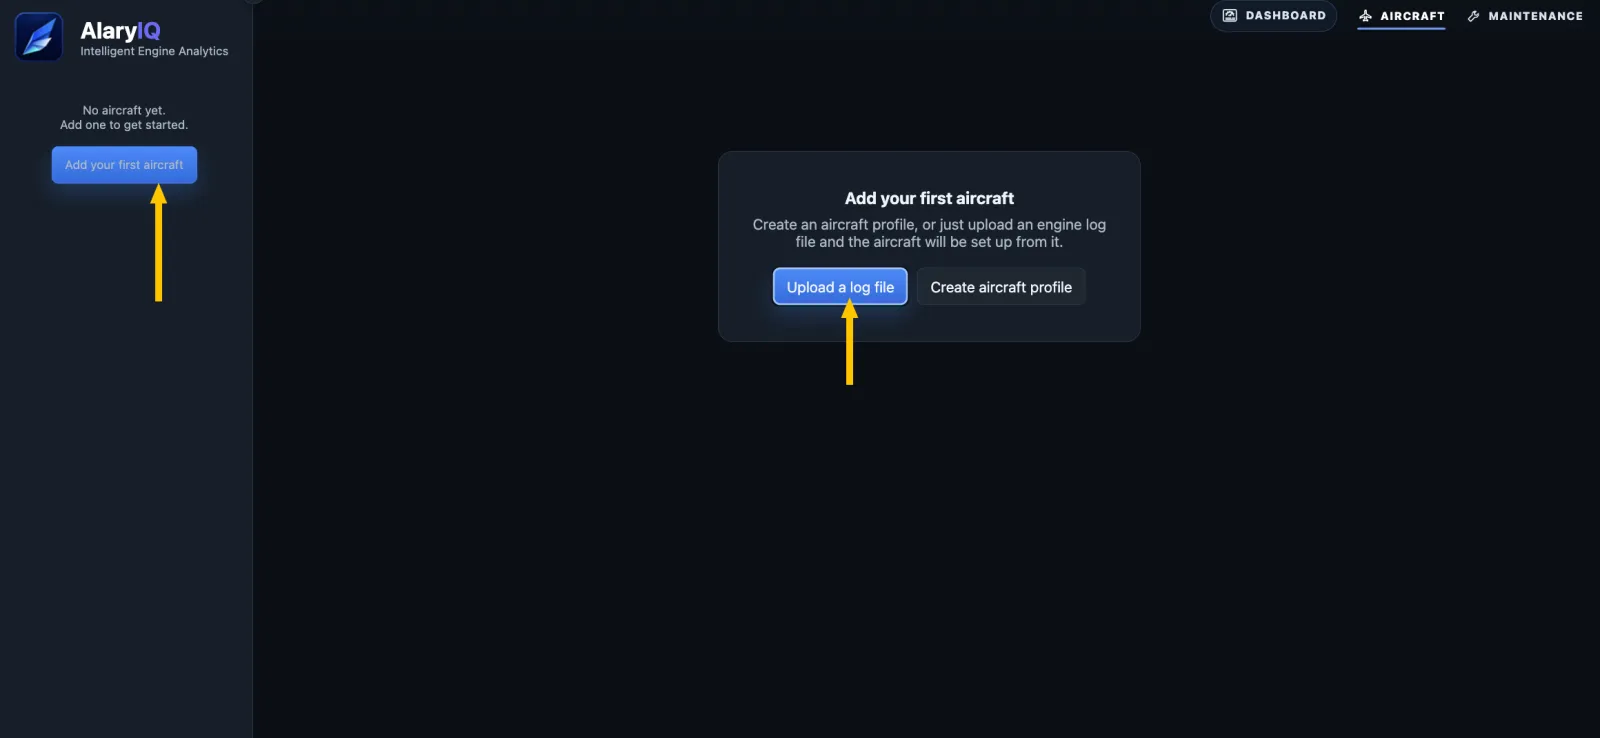
No aircraft available

Add an aircraft before uploading the first engine-monitor log.

FleetClick/drag to reorder aircraft

No aircraft found yet. Use the plus button or upload a log to create the first aircraft context.

1Add aircraft
2

Choose aircraft review settings

Aircraft workspace card with the review settings gear icon button
2Tap gear
Tap the gear icon on the aircraft card to open Review Settings.
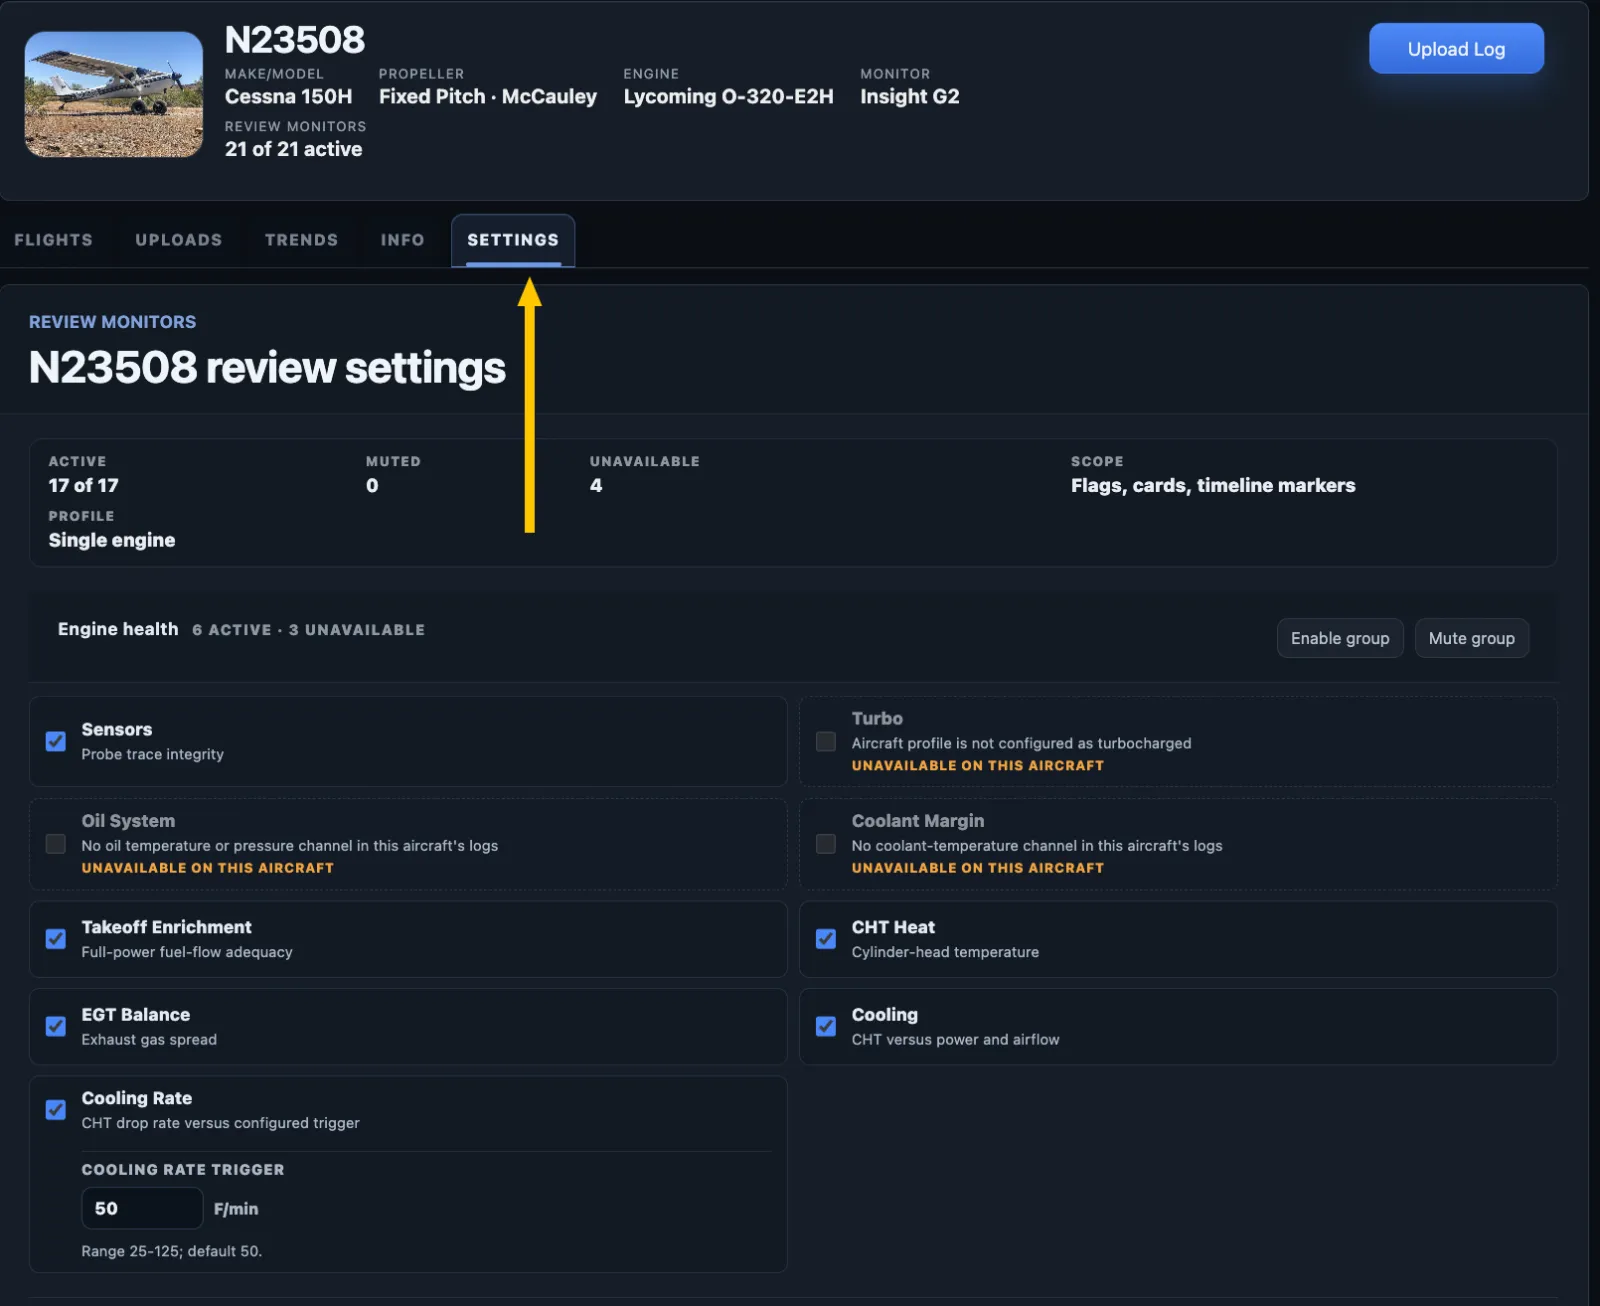
Review settings panel showing active monitor groups for a single-engine aircraft
Review Settings controls which monitor groups are active for the aircraft so flags, cards, and timeline markers match the review goal.

Review setting options

Enable the monitors that match the aircraft, installed sensors, and review goal. Muted monitors stay out of flags, cards, timeline markers, and score penalties where applicable.
Engine health

Sensors
Checks whether probe traces look trustworthy before other findings lean on them.
Turbo
Reviews boost, TIT, and heat context for turbocharged-engine operation.
Oil System
Watches oil temperature and pressure for behavior that deserves follow-up.
Takeoff Enrichment
Checks whether full-power fuel flow appears adequate during takeoff.
CHT Heat
Flags cylinder-head temperature exposure that may point to heat stress.
EGT Balance
Compares exhaust gas spread so one cylinder does not hide in the average.
Cooling
Compares CHT against power and airflow to explain whether heat is expected.
Cooling Rate
Looks for rapid CHT drops that can indicate aggressive cooling.

Event detection

CHT Rhythm
Looks for repeating CHT-only motion that may separate heat behavior from mixture behavior.
EGT Rhythm
Looks for stable-window EGT wobble that may suggest combustion or valve-related review cues.
CHT/EGT Pairing
Compares paired CHT and EGT movement to see whether temperatures are moving together.
Abnormal Combustion
Flags single-cylinder CHT runaway patterns when EGT does not rise with it.
Transient Divergence
Finds moments where cylinders fan apart and then reconverge after a transient event.
Descent EGT Dropout
Checks descents for one EGT cooling sharply compared with the others.
Induction Leak
Looks for RPM, fuel-flow, or MAP context lining up with an EGT rise.
Mag Check
Reviews ignition-test EGT response when the log includes a usable mag-check window.
Carb Ice
Uses carb-temperature, OAT, and power-loss cues to surface possible carb-ice context.

Aircraft systems

Start Charge
Checks whether voltage or current recovers normally after engine start.
Electrical
Watches bus-voltage behavior for drops, spikes, or unstable charging clues.
Probe Reference
Looks for shared reference behavior that can make multiple probe channels move together.

Multi-engine

Engine Delta
Compares engines against each other and appears only for multi-engine aircraft.
3

Upload one engine-monitor flight

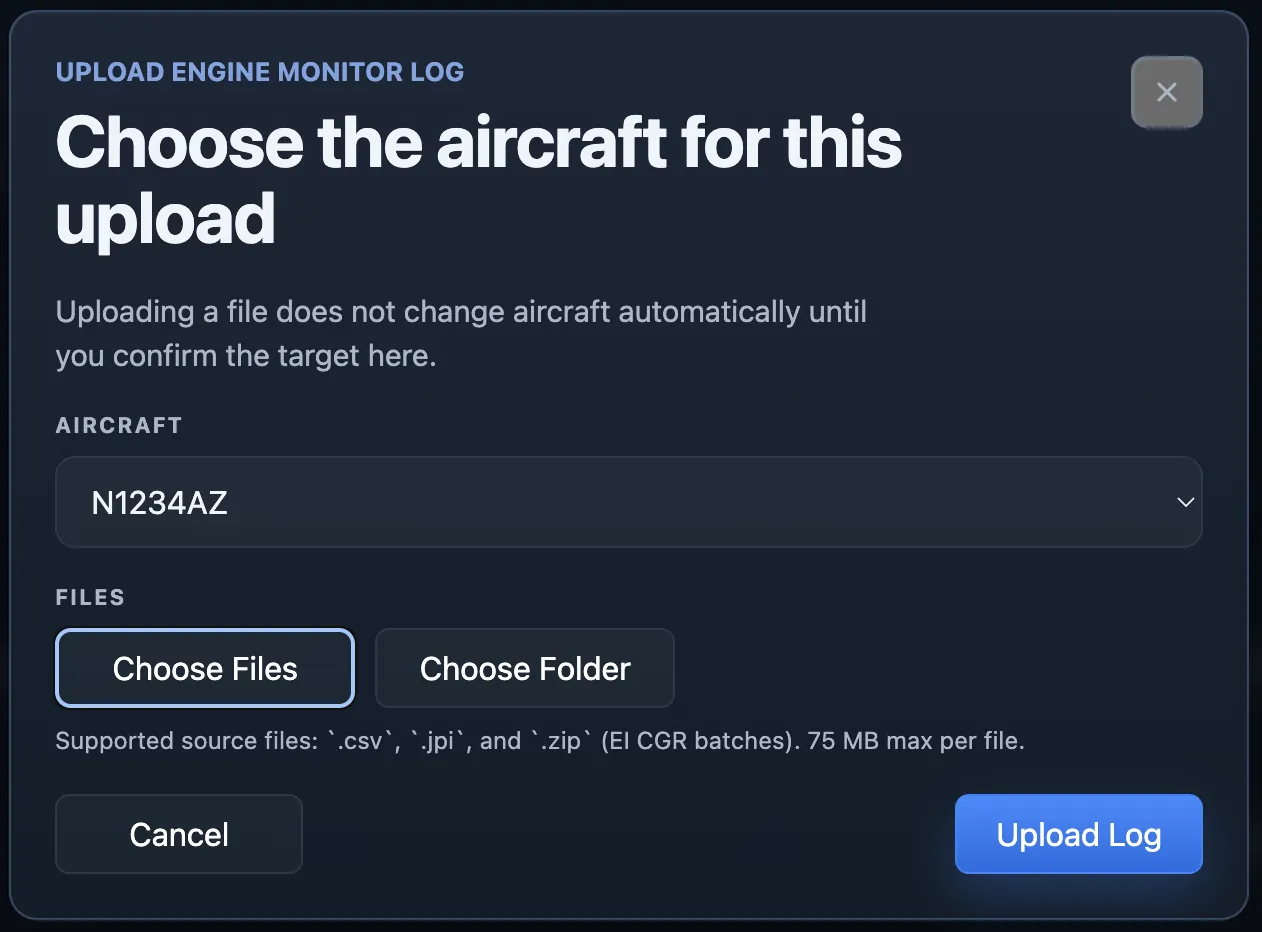
Upload Engine Monitor Log panel prompting the user to choose the aircraft before selecting files
Choose the target aircraft before selecting files so the upload is attached to the right history. Start with one flight — once you see what a clean import and review look like, add more history for trend comparison.

Choose the right monitor export

Garmin EIS / TXi / G3X / GI 275Engine/user log CSV with CHT, EGT, RPM, MAP, fuel flow, oil, voltage, and available GPS or air-data fields.
Dynon SkyView / HDXThe log file with engine data. Do not upload an airdata-only export.
JPI EDMRaw .JPI file or supported decoded JPI-style CSV.
Insight G2 / G4Insight CSV export. For twin or G4 data, confirm engine and cylinder mapping after import.
EI MVP-50PMVP-50P engine data export. Check fuel, TIT, pressure, and engine channels after import.
EI CGR-30P / 30CUpload P and C together, in one ZIP, or separately. AlaryIQ pairs matching files when both are present.
4

Check upload status

Aircraft upload history N1234AZ
Raw file Status Flights Latest job Size Uploaded Hash Actions
2022-05-30-N1234AZ16.2.4.8600-B-USER_LOG_DATA copy.csv N1234AZ/2022-05-30-N1234AZ16.2.4.8600-B-USER_LOG_DATA copy.csv
Completed
1/1
Completed 1/1 19 MB May 1, 2026 b3a17038fd95
The raw file is the Dynon engine-data CSV for N1234AZ. Completed status and 1/1 flights means the upload produced one supported flight. The Reprocess button is available when the upload can be run again.
5

Open the flight list

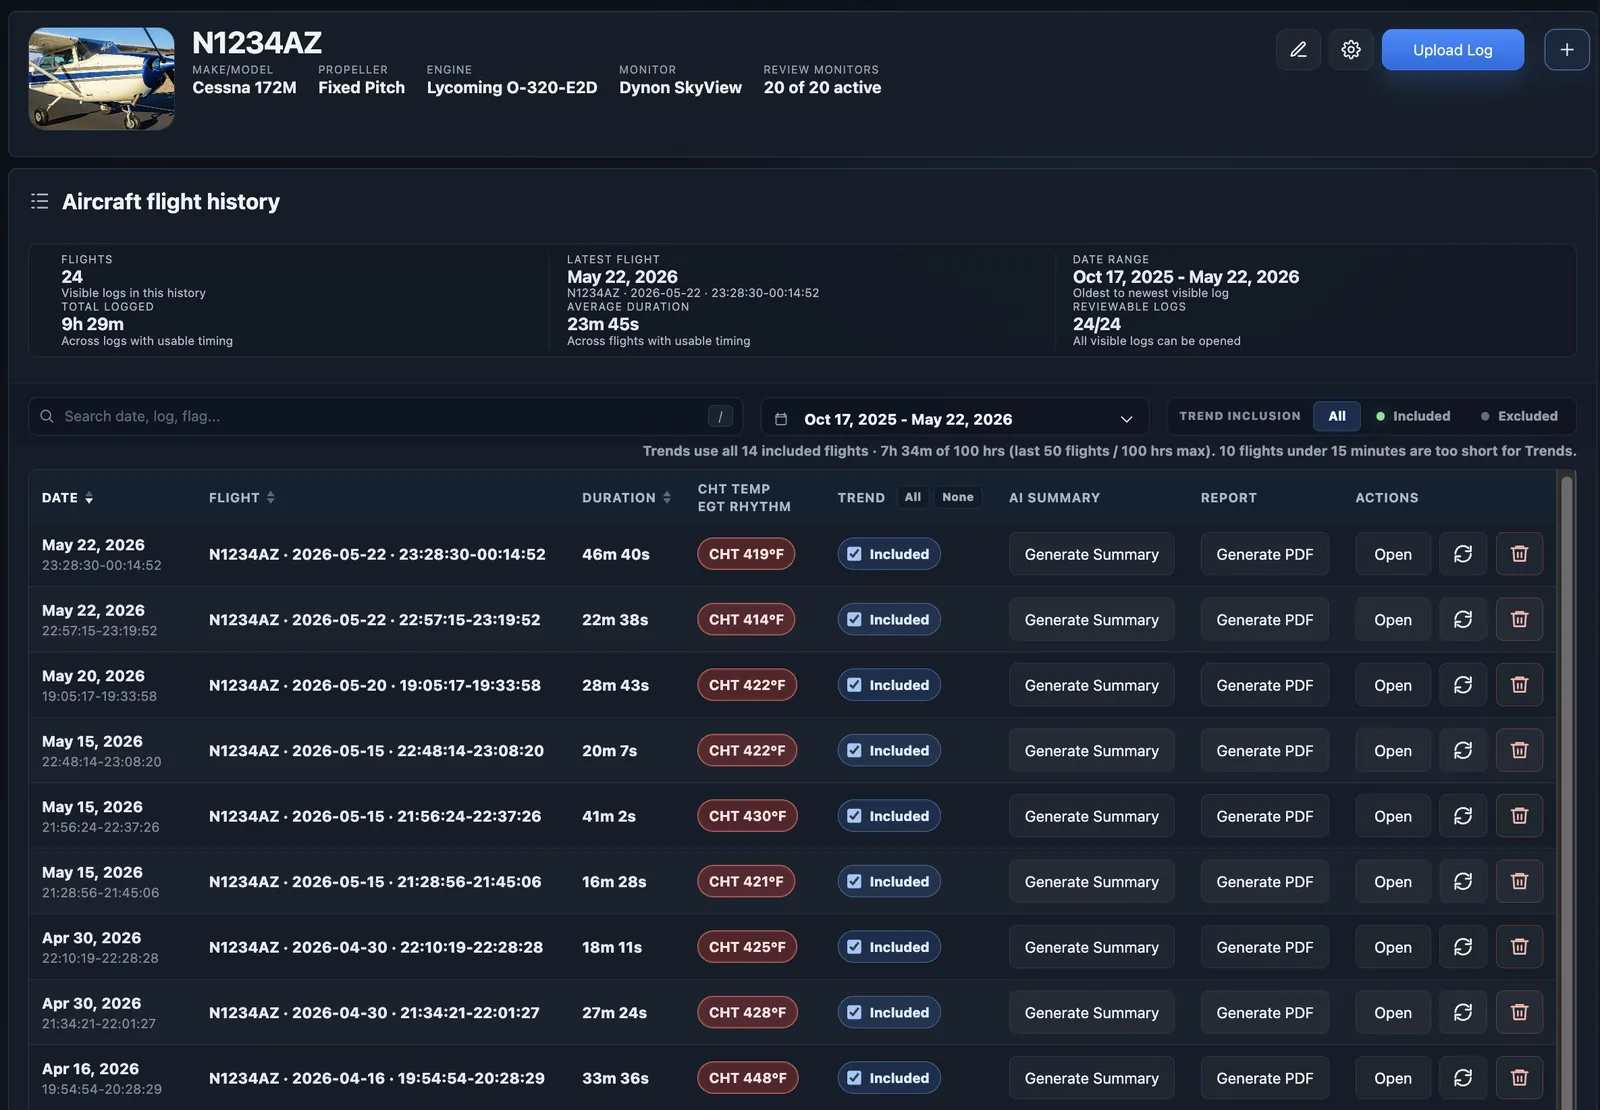
N1234AZ Aircraft flight history page with filters, flight rows, CHT flags, trend inclusion, AI Summary, report, open, reprocess, and delete actions
Flights is the review queue. Match the row by date, duration, CHT/EGT flag, trend inclusion, AI Summary, report, and row actions.
6

Start on Overview

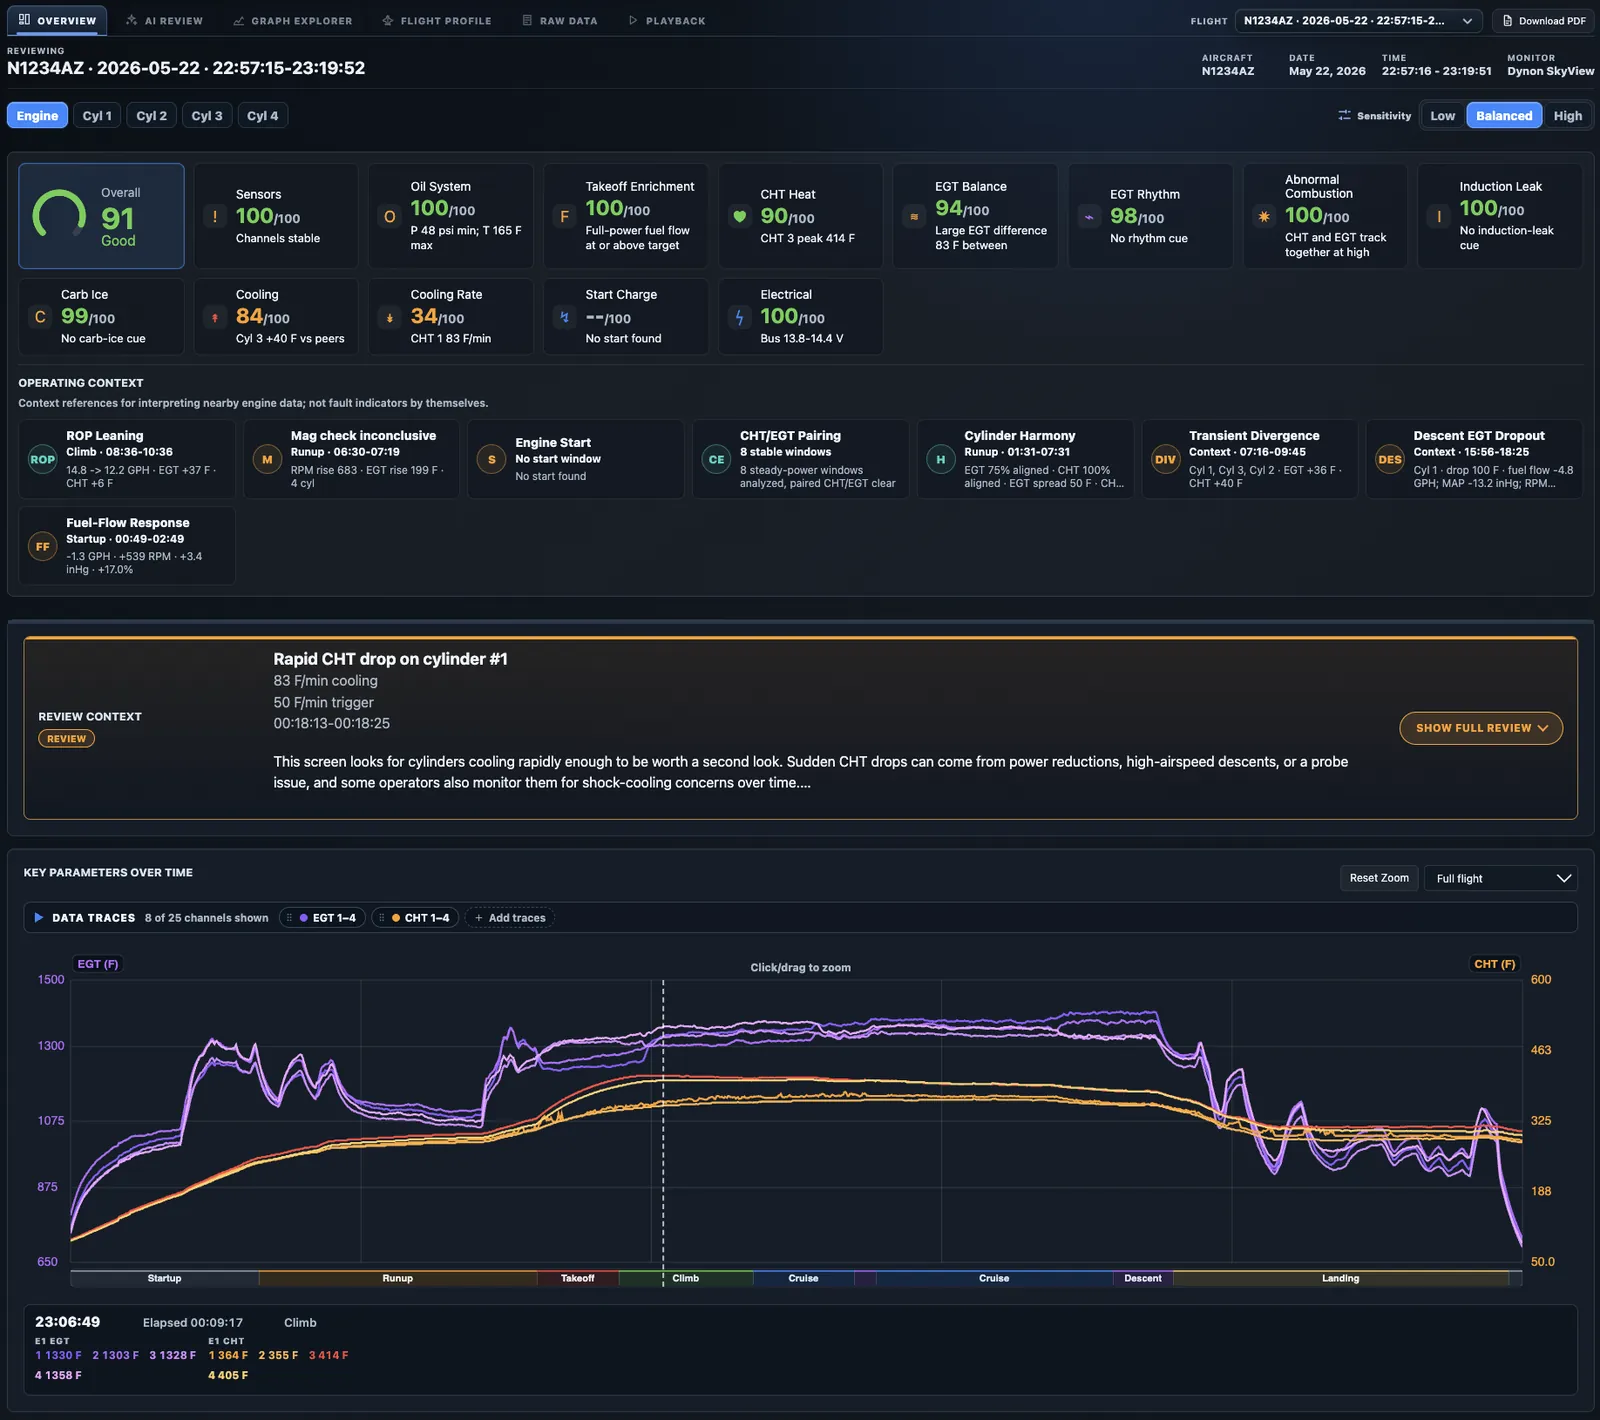
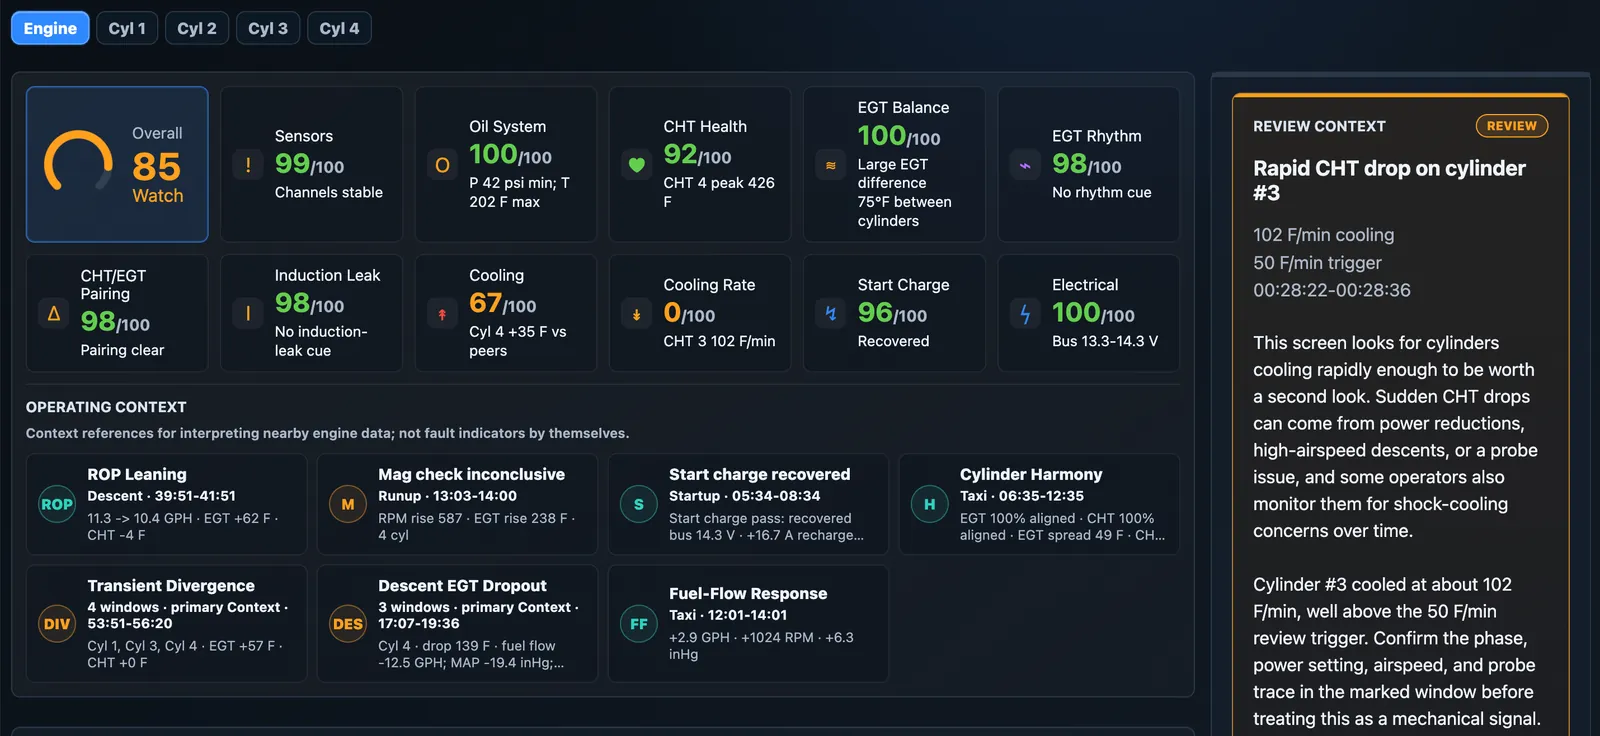
N1234AZ Overview page showing health cards, operating context, Rapid CHT drop review context, sensitivity controls, and key parameter traces
Overview is the main review screen. Confirm the selected flight, sensitivity setting, health cards, operating context, Review Context, and graph evidence.

Sensitivity — how much gets surfaced

Set this in the scope row at the top of the dashboard. It changes what AlaryIQ shows you, not the recorded data. The three settings:

High

Shows nearly everything, including minor or exploratory items. Useful for data-heavy review, but noisier.

Low

Shows fewer, more significant findings.

New to the cards? See Reading the data for what each one watches.
7

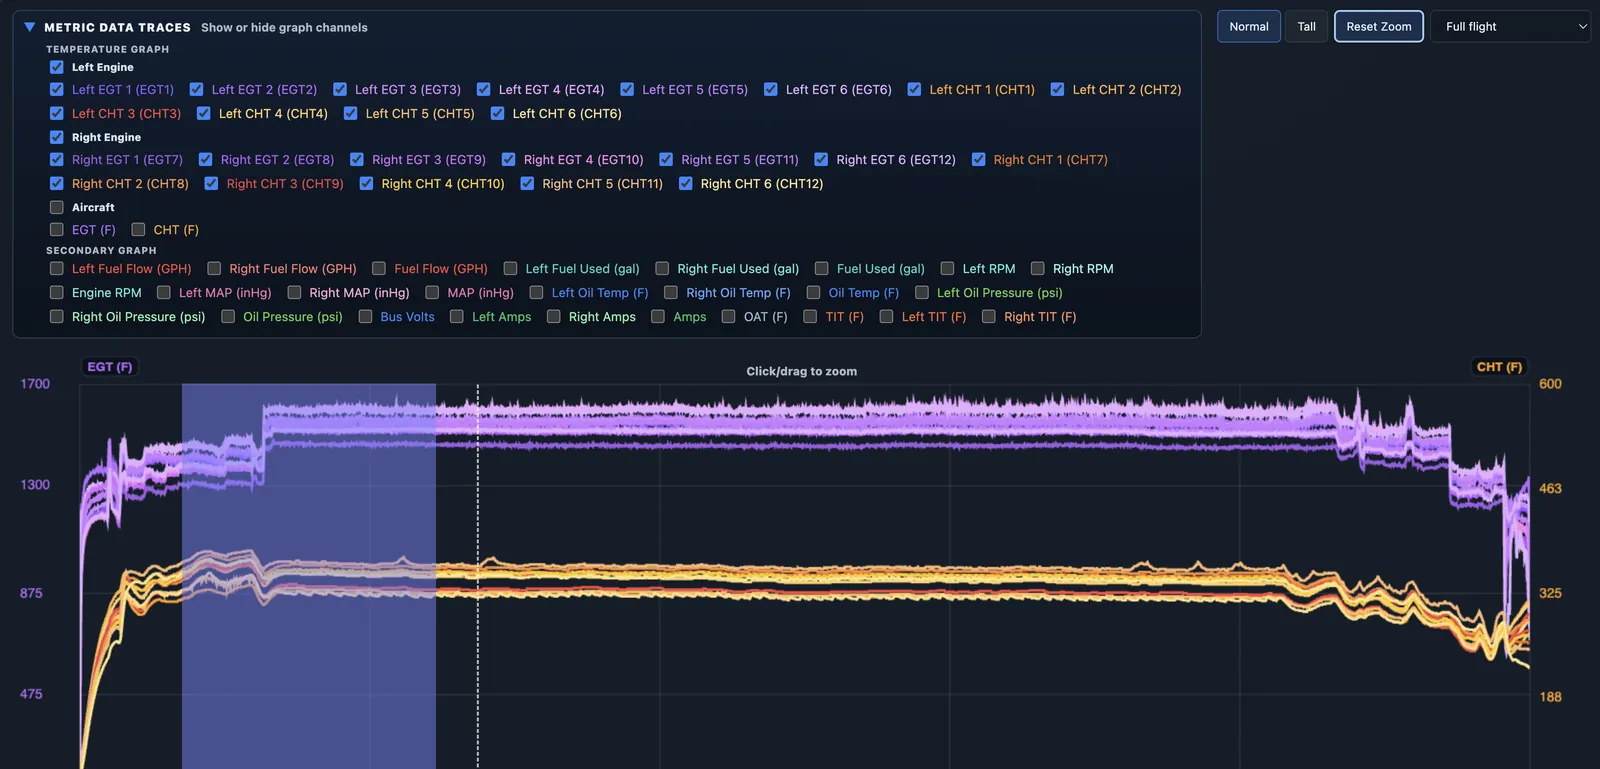
Verify graph evidence

Graph Explorer with metric traces expanded and a selected zoom window
Use the graph to confirm the phase, time window, affected channel, and companion traces before sharing a finding.
8

Read Review Context

Review Context panel with finding details, possible causes, supporting evidence, confidence, and caveats
Possible causes are inspection hypotheses. Use them with the graph, aircraft profile, and source data.
9

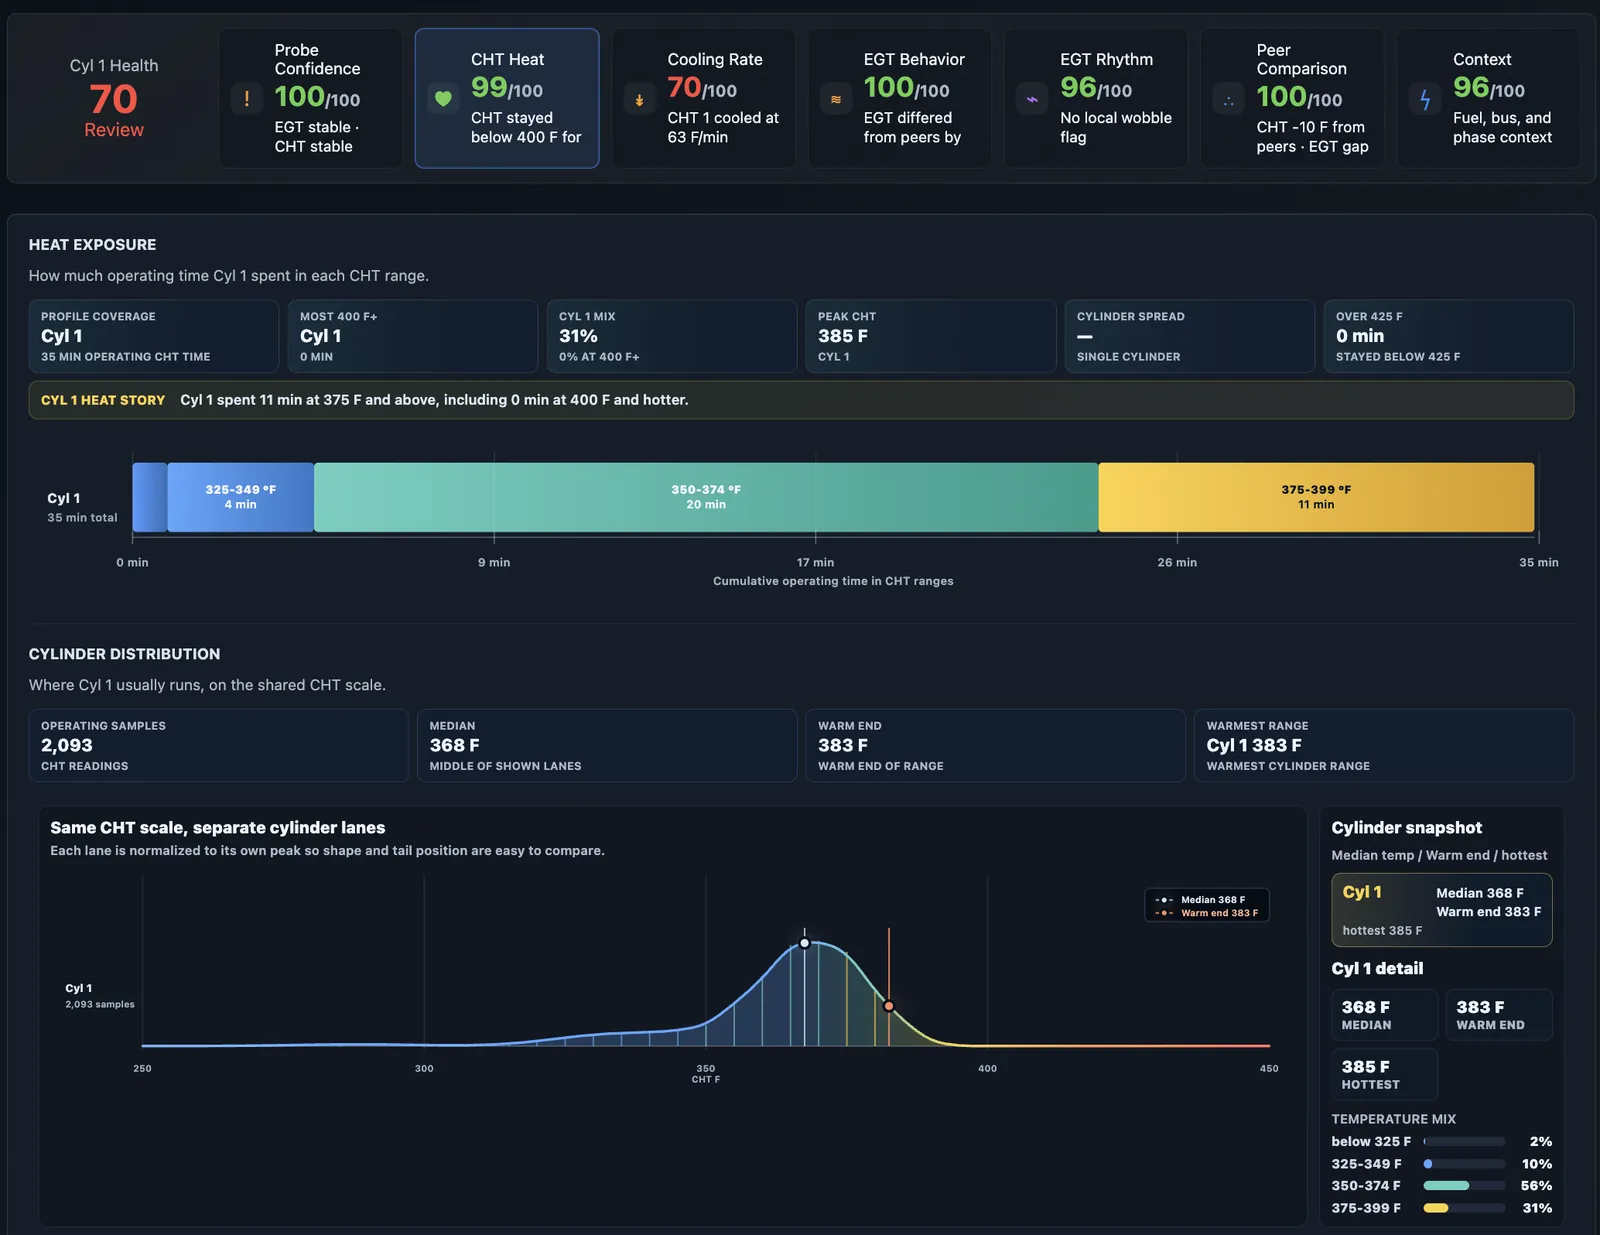
Check Cylinder Detail

Cylinder 1 detail page showing cylinder health cards, heat exposure, CHT range time, cylinder distribution, and cylinder snapshot
Cylinder Detail shows one cylinder at a time. This example is focused on Cyl 1 heat exposure and CHT distribution.
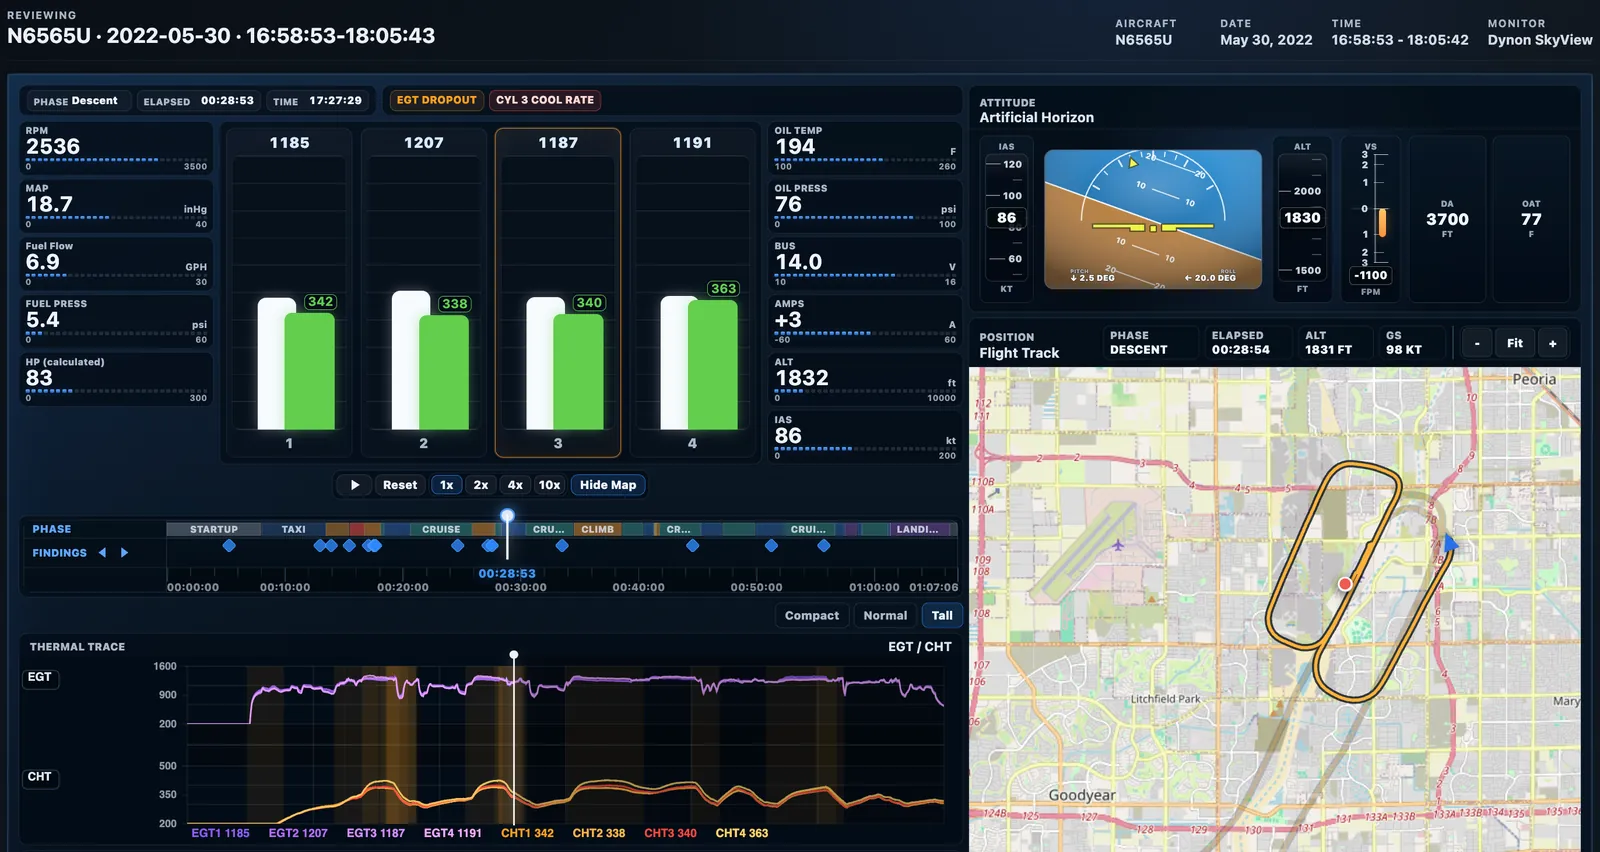
10

Use Playback when pilot context matters

Playback page with cockpit-style instruments, map, trace timeline, and playback controls
Playback helps connect engine data to how the flight unfolded when map, AHRS, airdata, or position channels are available.
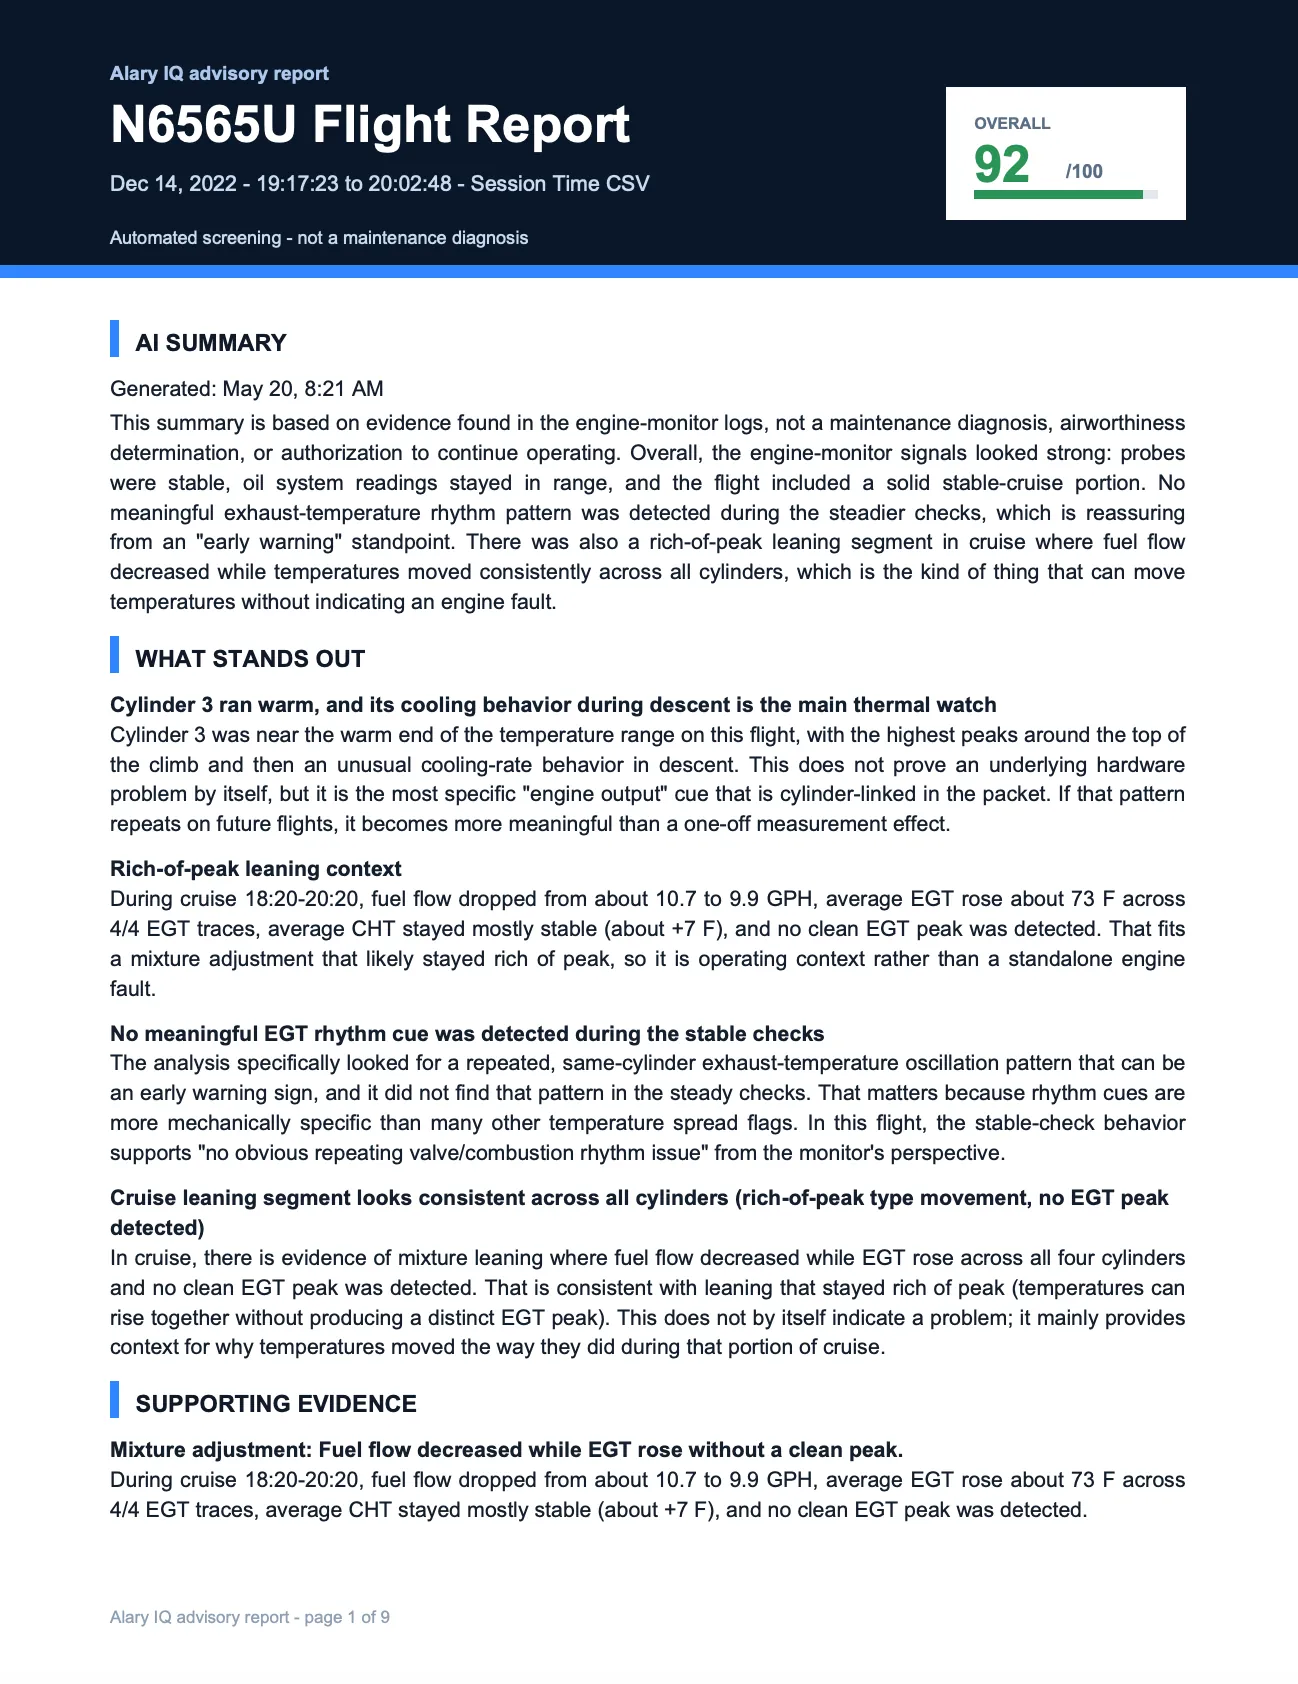
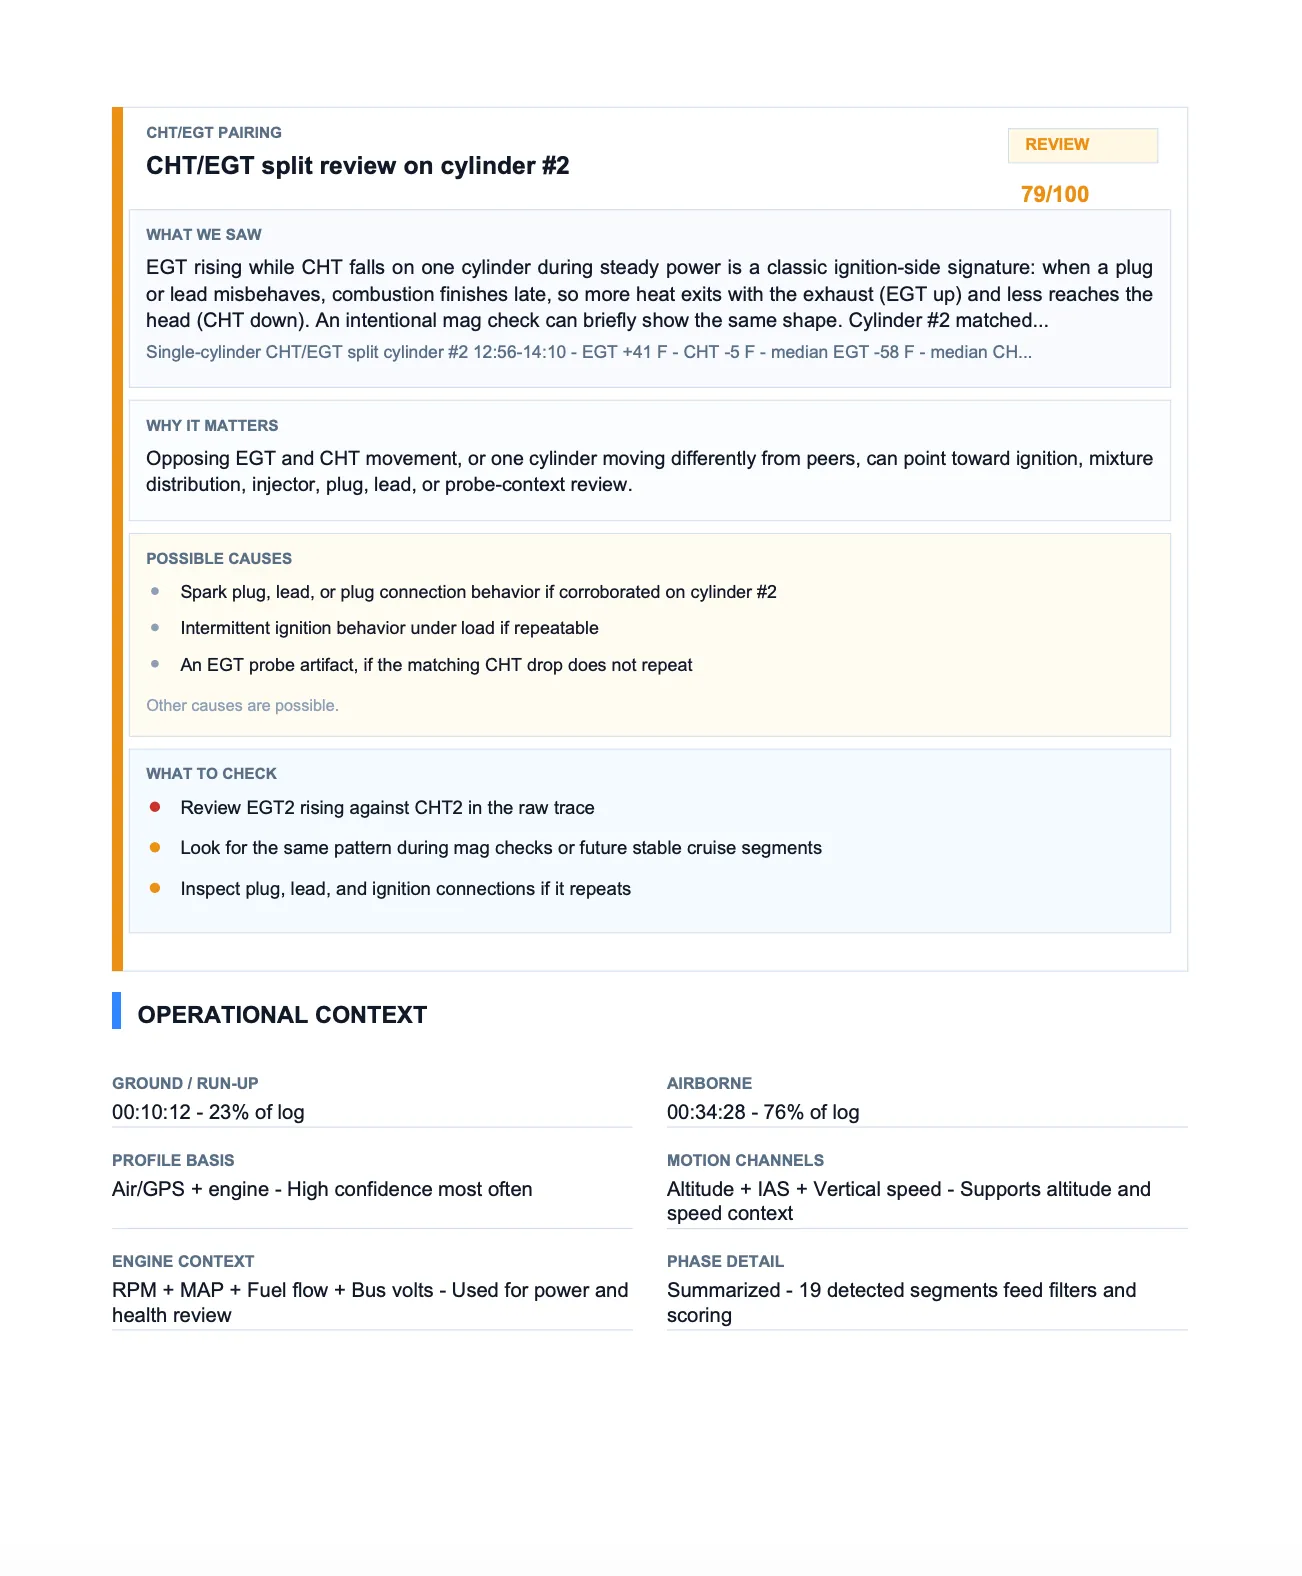
12

Generate a PDF report

Reading the data What each card watches

Learn to read the graphs behind the cards.

Every health card watches one kind of behavior in the trace data. These samples show the shape to look for — what to notice, and what a graph on its own cannot prove.

Hot CHT

Watches how long each cylinder’s head spends in each CHT temperature band — flagging one that lives in the hot ranges more than its peers.

Cyl 4 spent the most time at 400 °F+ Cyl 1 Cyl 2 Cyl 3 Cyl 4 <375 °F 375-399 400-424 425+ °F
Each bar is one cylinder; the colored segments show how long that cylinder spent in each CHT range over the flight (cooler blue/teal → hot orange/red). Cyl 4’s long orange-and-red tail means it lived at 400 °F+ the most. Time in the hot bands is the exposure to watch — not any single peak.

Why it mattersSustained head heat is a conversation about baffling, fuel distribution, and how the engine is operated — not a number to panic over.

  • Notice which cylinder carries the most orange-and-red time, how big the gap is versus its peers, and whether that lines up with climb, high power, or a hot day.
  • Don’t conclude a specific fault from the bands alone; running warmer than peers is a prompt, not damage.
  • Check next Graph Explorer for companion traces, Cylinder Detail to localize it, and Trends to see if it repeats.

EGT Rhythm

Watches a stable-power window for one cylinder’s EGT wobbling out of step with its peers.

30 F review floor (peak-to-peak) +20 0 F -20 0s 45s 89s Cyl 3 EGT valve-pattern fit other cylinders review floor
Each cylinder’s EGT shown as its difference from the engine average inside the steady-power window. The bold wave is the flagged cylinder; the white dashed line is the fitted valve pattern. Swinging past the dashed review-floor lines is the cue — not a valve diagnosis.

Why it mattersA cylinder that will not hold a steady rhythm at stable power can point to combustion or valve behavior worth a closer look.

  • Notice the affected cylinder, that its wave swings past the review-floor lines, and that the window is genuinely stable power — not a climb, descent, or mixture change.
  • Don’t conclude a valve problem; rhythm is a screening cue, not a borescope.
  • Check next the same cylinder’s CHT, probe confidence, and whether the rhythm shows up across flights.

Sensors

Watches whether each channel is trustworthy before any other card leans on it.

CHT °F CHT 4 keeps dropping out Taxi Takeoff Climb Cruise CHT 4 (dropping out) CHT 1–3 (stable)
One CHT probe (red) keeps dropping out — cutting toward zero and recovering — while its peers track smoothly as the engine warms. The cylinder may be fine; the probe or wiring is the suspect, and findings that lean on this channel get less trust.

Why it mattersA bad probe, missing channel, or noisy signal can manufacture misleading findings elsewhere — so sensor quality is checked first.

  • Notice which channel lost trust, when in the flight, and how — a dropout, stuck stretch, out-of-range, or erratic jump — and which findings lean on that channel.
  • Don’t conclude the cylinder is failing when the more likely story is the sensor.
  • Check next which other cards depend on that channel, and treat them with lower confidence until the sensor is understood.

Operating Context

Marks flight and operating conditions — leaning, power changes, pattern work, descent, shutdown — that explain trace movement.

Operating Context is a row of chips, not findings. Each marks an event — a lean, a mag check, a descent — with its phase and time, so you can read nearby data in the right light.

Why it mattersContext cards are the antidote to false alarms: a lean, descent, pattern cycle, or shutdown explains movement that would look suspicious on its own.

  • Notice which event a card marks and which traces it lines up with.
  • Don’t conclude a context card is a fault — it usually explains the data rather than flagging it.
  • Check next whether a nearby finding sits inside one of these windows before you escalate it.

Every context card, explained

ROP
ROP Leaning

Marks a cruise leaning window that stayed rich of peak — fuel flow eased back, EGTs rose, and no peak was crossed. That’s a normal way to lean for power and cooler heads; the card is here so a rising EGT during leaning isn’t misread as trouble.

LOP
LOP Leaning

Marks a lean-of-peak sweep: fuel flow falls, the EGTs peak in turn, then the engine settles lean of peak. A clean LOP pull is a deliberate, efficient setting; the card explains the EGT rise-then-fall so it reads as mixture management, not a fault.

M
Mag check

Looks for a runup mag check by matching the RPM drop to each cylinder’s EGT rise as a magneto is selected. A small RPM drop with an even EGT rise is expected; a weak or missing response on one cylinder is the part worth a look. (No RPM channel means it can’t be evaluated.)

S
Start charge

Checks the seconds after start — the bus should sag for cranking, then recover above the charging line. A clean recovery is the normal signature; a weak or unconfirmed one is the prompt (the Start Charge card above shows the full read).

CE
CHT/EGT Pairing

Compares one cylinder’s CHT and EGT movement during steady-power windows. How tightly they move together is context for reading ignition, injector, cold-cylinder, mixture, or sensor patterns — not a verdict on its own.

H
Cylinder Harmony

Highlights the best loaded window where all cylinders’ EGTs and CHTs moved together with a steady spread. It’s a reassuring, positive signal — the engine looked well-balanced there — rather than a problem.

CHT
CHT Rhythm

Flags a repeating CHT-only wobble during steady power when fuel flow, MAP, RPM, and that cylinder’s EGT did not move with it. Because nothing else moved, it usually points to the probe, connector, bayonet seating, or very local cooling air — an instrumentation check, not combustion.

DIV
Transient Divergence

Catches short stretches where one cylinder’s EGT or CHT briefly pulled away from the rest. A brief split during a power or mixture change is usually normal; the same cylinder splitting again across flights can point to a fuel, ignition, or intake issue worth checking.

DES
Descent EGT Dropout

Marks low-power descents where one EGT cooled faster than its peers. On a throttled-back descent that’s often just airflow and reduced fuel; the card lets you weigh it against fuel flow, MAP, RPM, and whether it repeats before reading into it.

FF
Fuel-Flow Response

Checks that fuel flow moved sensibly with RPM, MAP, and percent power through a power change. Coherent movement confirms a normal transition; a flat, opposite, or noisy response is the prompt — and it keeps ordinary throttle changes from looking like engine faults.

Start Charge

Watches the seconds around engine start: the bus dips while cranking, then should climb back above the charging line as the alternator picks up the battery recharge.

Bus V start charging line 13.1 V+ cranking dip recovers & holds above the line
Demonstrates a normal cranking dip recovering above the charging line. A brief sag is expected; the graph alone does not confirm battery or alternator health.

Why it mattersA shallow recovery, a slow climb back above the charging line, or a missing recharge current spike can open a battery or charging-system conversation before it leaves you stranded.

  • Notice how deep the cranking dip goes, how quickly the bus climbs back above the charging line, and whether a recharge current (amp) spike follows the start.
  • Don’t conclude a dead battery or failed alternator from one start — cold starts sag deeper, and a single start is not a trend.
  • Check next Trends to see if recovery is slipping over time, the Electrical card for in-flight bus behavior, and a battery/charging check with your mechanic if it repeats.

Oil Pressure vs Temperature

Watches how oil pressure settles as the oil warms — once warm, the pressure samples should cluster in a tight, steady band.

middle 50% Sample density typical warm 56 psi 50 55 60 oil pressure (psi), warm samples
Demonstrates warm oil-pressure samples clustering in a tight band near the typical pressure. The center and width of the band are the read — not any single sample.

What each part means

  • Bars (sample density) — how often warm pressure landed at each value; the tall bars are where it usually sat.
  • Middle 50% — the solid inner box: half of all warm readings fall here. A narrow box means steady pressure.
  • Warm range — the dashed outer box: the full spread of warm samples, edge to edge.
  • Typical warm — the white line and dot: the median warm pressure (here 56 psi), the one number to remember.

Why it mattersWarm oil pressure that sits too low, too high, or keeps wandering instead of settling is a classic prompt to check oil level, the sender, or the pump before a trend builds.

  • Notice the typical warm pressure, the warm oil temperature, and how tight the band is — a wide or shifted band is the prompt, not any single sample.
  • Don’t conclude a pump or bearing problem from one warm-up — cold oil reads higher and more variable by design.
  • Check next Trends for the warm-pressure band over time, your aircraft’s published oil-pressure limits, and an oil-level or sender check with your mechanic if the band drifts.

Sensitivity

Controls how readily items surface — the same flight shows more on High and less on Low.

Deviation Balanced surfaces above here High also surfaces above here both flag this High only
Demonstrates why High shows more: a minor bump clears only the High threshold. More items is not more correct — it is a noisier, more exploratory view.

Why it mattersSensitivity changes what surfaces, not the recorded data. Balanced suits most owners; High is an exploratory pass; Low keeps only the most significant items.

  • Notice which items are new when you raise sensitivity — those are the lower-priority ones.
  • Don’t conclude a High-only item is a problem; it is an item to inspect, not proof.
  • Check next the graph to confirm a High-only item is visible, phase-relevant, and backed by clean sensors, then return to Balanced.

Worked examples Card to conversation

Four common reviews, start to finish.

Each example turns a card into something you can verify and, if needed, hand to a mechanic in plain language.

Watch

Amber CHT card

A cylinder ran hot — for example, “Cylinder 4 ran hotter in climb.”

  1. Click the CHT card and see which cylinder drives the status.
  2. Open the graph with CHT, EGT, fuel flow, RPM, MAP, and OAT visible (see the Hot CHT sample above).
  3. Decide the phase: climb, cruise, pattern work, or low-airflow ground operation.
  4. Compare Trends to see whether the same cylinder repeats.

Hand off “Cyl 4 ran ~40°F hotter in climb, repeated over three flights” — not “Cyl 4 is broken.”

Review

EGT Rhythm item

One cylinder’s EGT will not hold a steady rhythm at stable power.

  1. Open the EGT Rhythm finding and note the affected cylinder.
  2. Inspect the highlighted stable-power window (see the EGT Rhythm sample above).
  3. Compare that cylinder’s EGT against its peers in the same window.
  4. Confirm probe confidence so a noisy sensor is not the real story.

Treat it as an item to discuss with a qualified mechanic — not a valve diagnosis read off a graph.

Sensor

Sensor warning

A channel looks missing, stuck, stepped, or noisy.

  1. Click Sensors and identify the suspect channel.
  2. Confirm whether it is missing, stuck, noisy, stepped, or out of step with companion data.
  3. Check which other findings rely on that channel.
  4. Lower your confidence in those dependent findings until the sensor is understood.

A bad probe can invent problems elsewhere — clear the sensor question before trusting the rest.

High only

Item appears only on High

An item shows up when you raise sensitivity but not on Balanced.

  1. Switch Balanced → High only when you want a deeper, exploratory pass.
  2. Note which new items appear (see the Sensitivity sample above).
  3. Open the graph and check the item is visible, phase-relevant, and backed by clean sensors.
  4. Return to Balanced for the normal owner review.

Treat High-only items as lower-priority evidence to inspect — not automatic problems.

Behind the scenes

What AlaryIQ does after the log is uploaded

AlaryIQ reads the monitor export, normalizes the channels, identifies phases and operating context, checks sensor quality, runs deterministic detectors, builds evidence windows with confidence and caveats, then uses AI to turn that bounded evidence into readable review language.

The AI is not guessing from raw log rows. The detector work happens first. The summary is a plain-language translation of structured evidence.

Health cards

Areas to check first.

Findings

Evidence-backed items to investigate, not diagnoses.

Possible causes

Ranked inspection hypotheses.

Confidence

How strongly the available data supports the item.

Sensitivity

How readily items surface. Balanced is normal; High shows more minor items; Low shows fewer, more significant ones.

Evidence windows

The time ranges where the behavior shows up.

Sensor quality

Whether a channel is trustworthy enough to interpret.

Operating Context

Conditions that help explain the data. These cards are not always problems.

Trends

Cross-flight comparison for the same aircraft.

AI Summary

Plain-language review text based on deterministic evidence.

PDF Report

A shareable advisory evidence packet.

Read findings as questions, not verdicts: they are areas to investigate, and a clean result is not proof the engine is safe to operate or airworthy. AlaryIQ adds context to recorded data — it does not replace inspection, service data, or pilot judgment.