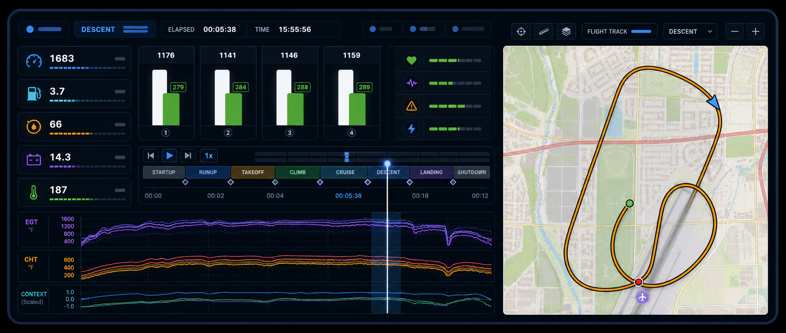
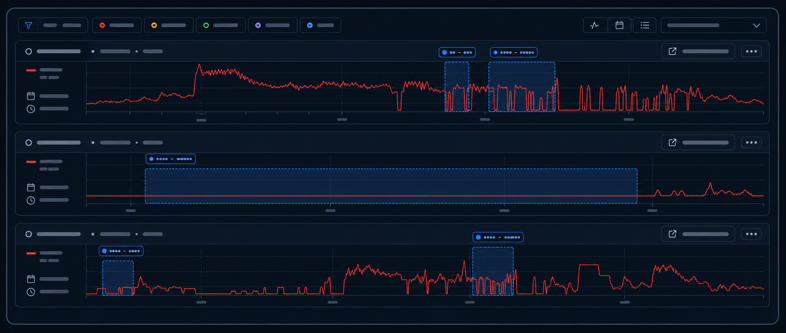
Phase-aware charts
Review engine traces in the context of startup, runup, takeoff, climb, cruise, descent, landing, and shutdown.
Turn dense engine monitor exports into readable notes and reports for maintenance conversations, owner review, and flight-by-flight comparison.
Advisory screening only. AlaryIQ does not replace mechanic inspection, manufacturer guidance, or pilot judgment.
Review engine traces in the context of startup, runup, takeoff, climb, cruise, descent, landing, and shutdown.
Compare EGT and CHT behavior by cylinder, then separate operating context and sensor quality from patterns worth discussing.
Create readable review summaries with supporting evidence, confidence language, and next-step context for a mechanic conversation.
Track CHT, EGT, fuel flow, oil pressure/temp, electrical behavior, and recurring findings across flights.
Flag missing sensors, stuck probes, noisy traces, time gaps, or files that need review before drawing conclusions.
Supported monitors
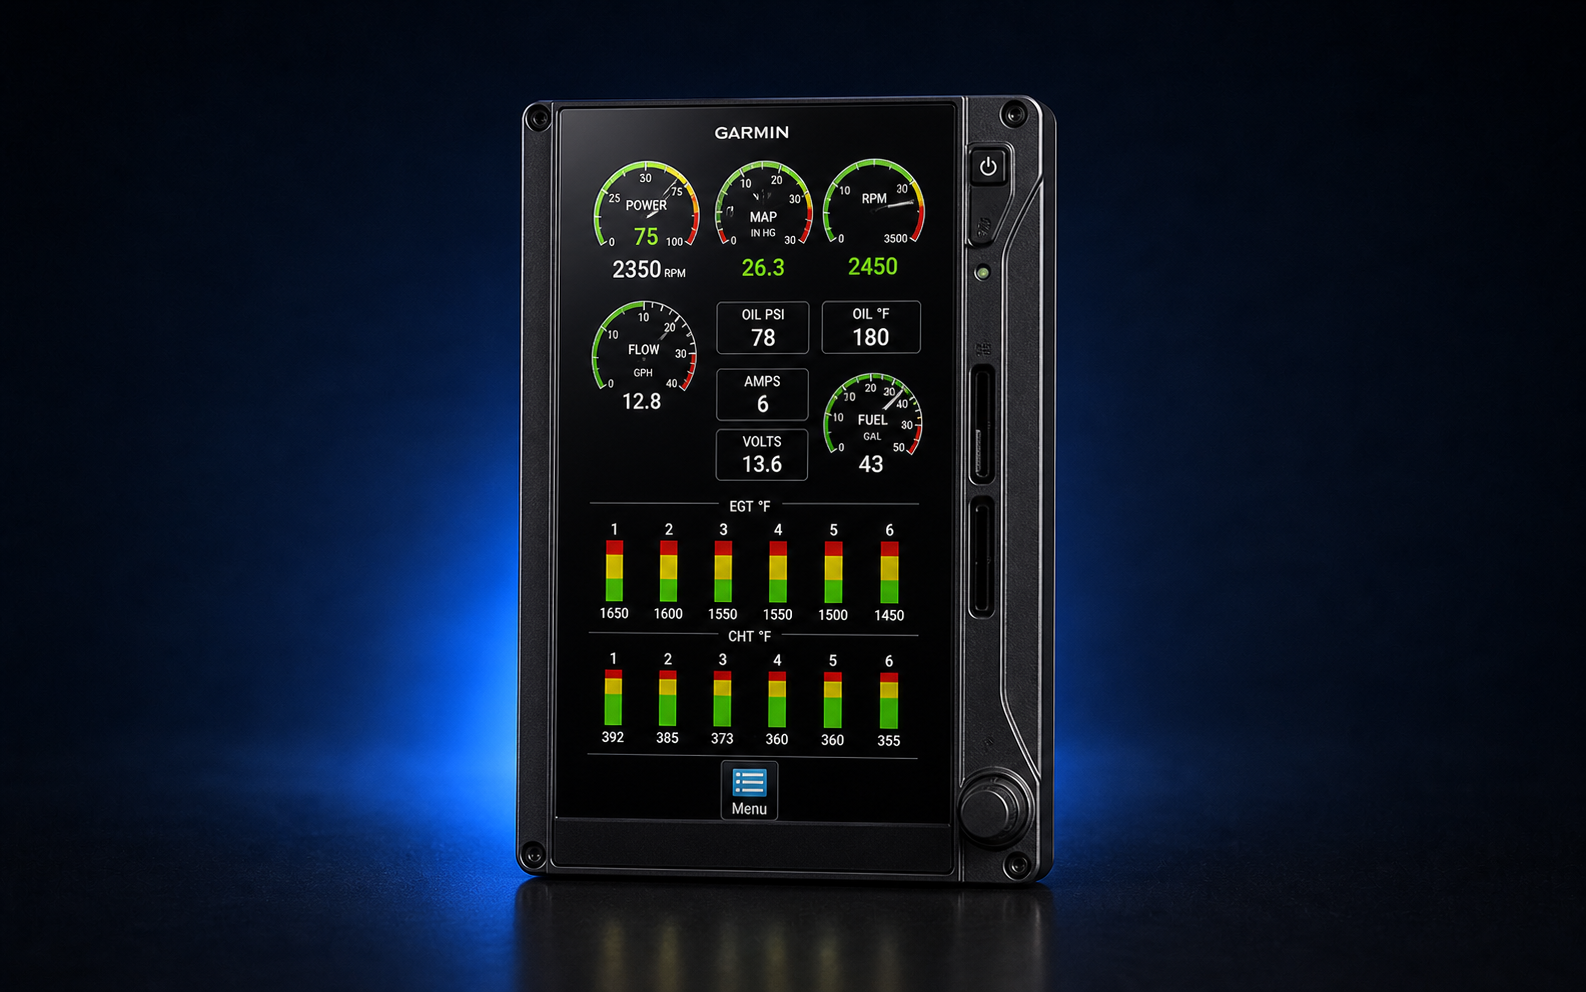
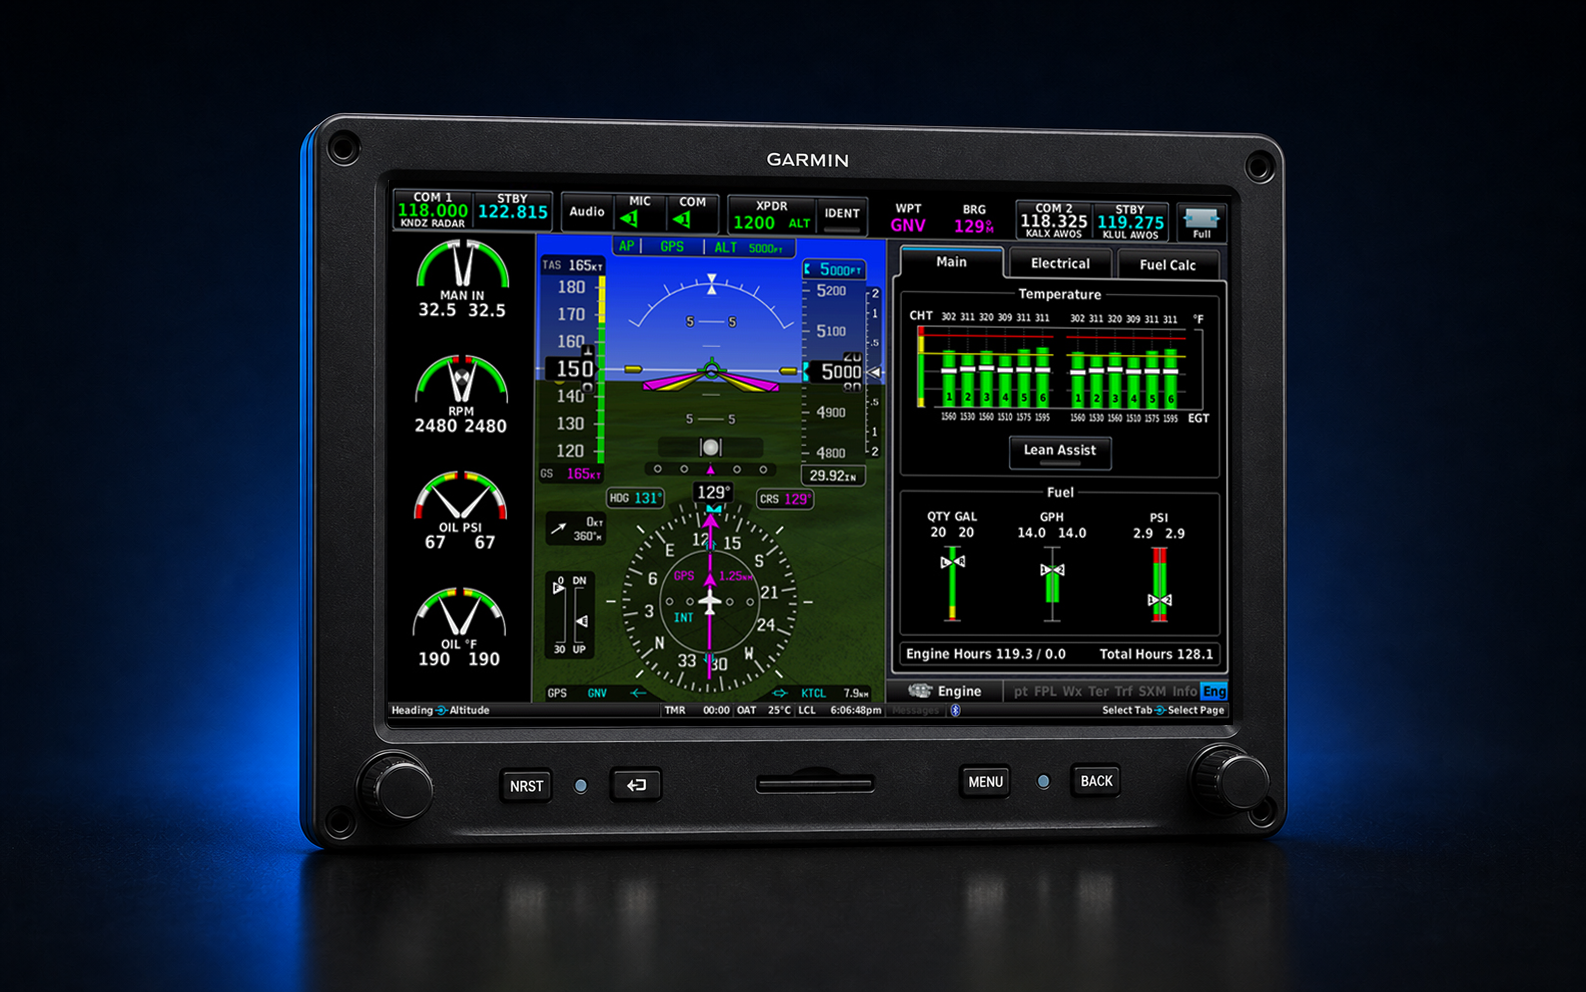
AlaryIQ normalizes common piston-aircraft engine monitor exports into one review workspace, including Garmin, JPI, Insight, and Electronics International formats.

AlaryIQ turns engine-monitor data into engine-health evidence, trend history, and maintenance-ready reports you can act on with confidence.
Owner plans
Plan selection is informational for now. Posted pricing reflects introductory offer pricing while we're still building out the product. Stay tuned!
Try AlaryIQ with one aircraft and two logs.
Great for single-aircraft owners.
Multi-engine: $79/year
The best balance for active aircraft owners.
Multi-engine: $129/year
For serious annual and prebuy workflows.
Multi-engine: $179/year
One-time report
A focused one-time report for a buyer, seller, mechanic, or broker who wants a serious engine-data package before a purchase decision.
Multi-engine: $149
This is like a Carfax-style engine-data review: a buyer can upload logs, or a seller can provide this report to potential buyers via a .pdf and shareable link.
AlaryIQ is building centralized aircraft management, team access, and scalable reporting for clubs, schools, shops, and multi-aircraft operations.
Up to 5 aircraft, 200 logs per aircraft, and 500 analysis credits.
Up to 15 aircraft, 250 logs per aircraft, and 1,500 analysis credits.
Custom aircraft volume, branded reports, and parser support for larger operations.
Analysis credits
Uploading logs, reviewing charts, and basic trend views do not use credits. Credits never expire.
High-level overview of one flight.
Export a maintenance-ready report for one flight log. If generated, the AI Analysis Summary is included.
Includes up to 50 flight-log trend analysis with AI Summary and PDF packet.
20 AI analysis summaries or 100 PDF evidence reports.
40 AI analysis summaries or 200 PDF evidence reports.
100 AI analysis summaries or 500 PDF evidence reports.
Not yet. This page shows intended pricing while authentication and billing are still being built.
The current pricing plan treats purchased credits as non-expiring.
No. AlaryIQ provides advisory screening and evidence organization for qualified review.
FAQ
AlaryIQ turns engine monitor exports into readable notes and reports. These questions explain what you can upload, what the review means, and how to use the results.
The current parser work targets common piston aircraft engine monitor exports, including Garmin, JPI, Insight, and Electronics International style logs.
No. It highlights review cues, operating context, and data-quality concerns so a qualified person can evaluate the aircraft with proper inspection and records.
The app separates startup, runup, takeoff, climb, cruise, descent, landing, and shutdown so temperatures and pressures are read in the right flight context.
Yes. The workspace is being shaped around aircraft history, trend snapshots, and selected-flight comparisons to make repeat behavior easier to spot.
Owners, pilots, shops, and analysts who want readable engine-monitor review notes without losing the supporting evidence behind each flag.
No. Treat AlaryIQ as a screening and communication tool. Maintenance decisions belong with certificated mechanics, manufacturer guidance, and aircraft records.
Reports include readable review notes, supporting chart context, advisory findings, and source data references that help explain what the log shows.
Yes. Reviews can be exported as reports for maintenance conversations, owner records, and comparison across flights.
You can request support by sharing the monitor make, model, export type, and sample file details so the format can be evaluated.
AlaryIQ combines charts, context, review notes, and report-ready language instead of leaving every trace to be interpreted manually.
Yes. The workspace supports multi-engine review and can compare left/right, front/rear, or engine-indexed data when those fields are available in the log.
No. AlaryIQ organizes evidence and review cues, but repair decisions belong with qualified maintenance professionals and aircraft-specific documentation.
How It Works
This page walks through the normal workflow: create or confirm the aircraft profile, upload a log, open the Dashboard, inspect the graph and findings, then use the supporting pages for history, trends, maintenance notes, and reports.
Quick Start
Use this order when you are reviewing a new flight. It keeps setup problems from being mistaken for engine behavior.
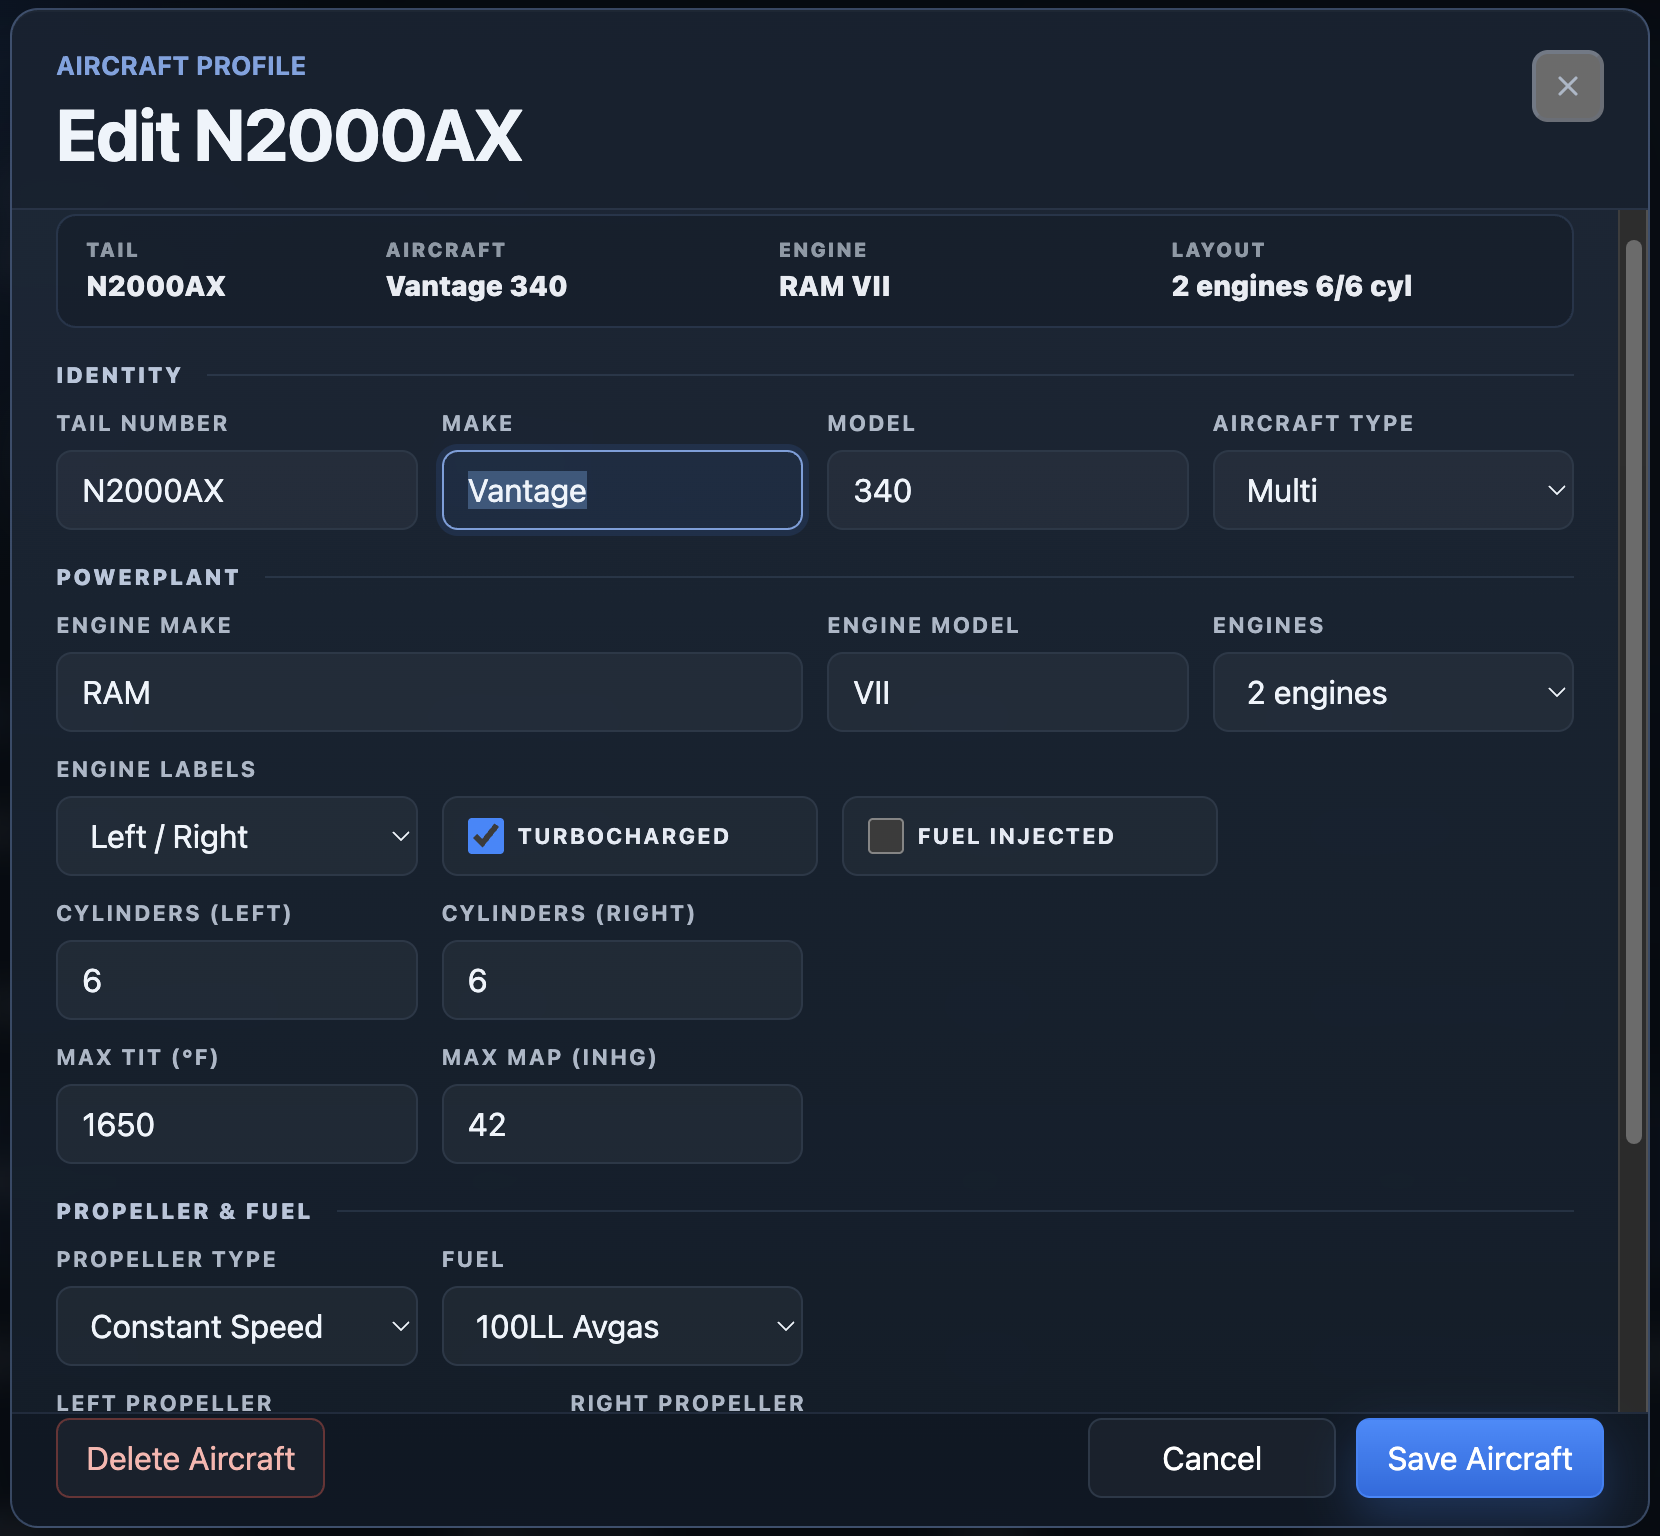
Step 1
The aircraft profile tells AlaryIQ how to interpret the file. A single-engine aircraft, a twin, a turbocharged engine, and different monitor models should not be reviewed with the same assumptions.
Tail number, make, model, and photo help you avoid attaching a log to the wrong airplane.
Engine count and engine labels matter for multi-engine charts and cross-engine comparisons.
Monitor make/model helps route files through the right parser and label the source data correctly.
Fuel type, turbo status, and limits help the review separate normal operating behavior from review cues.
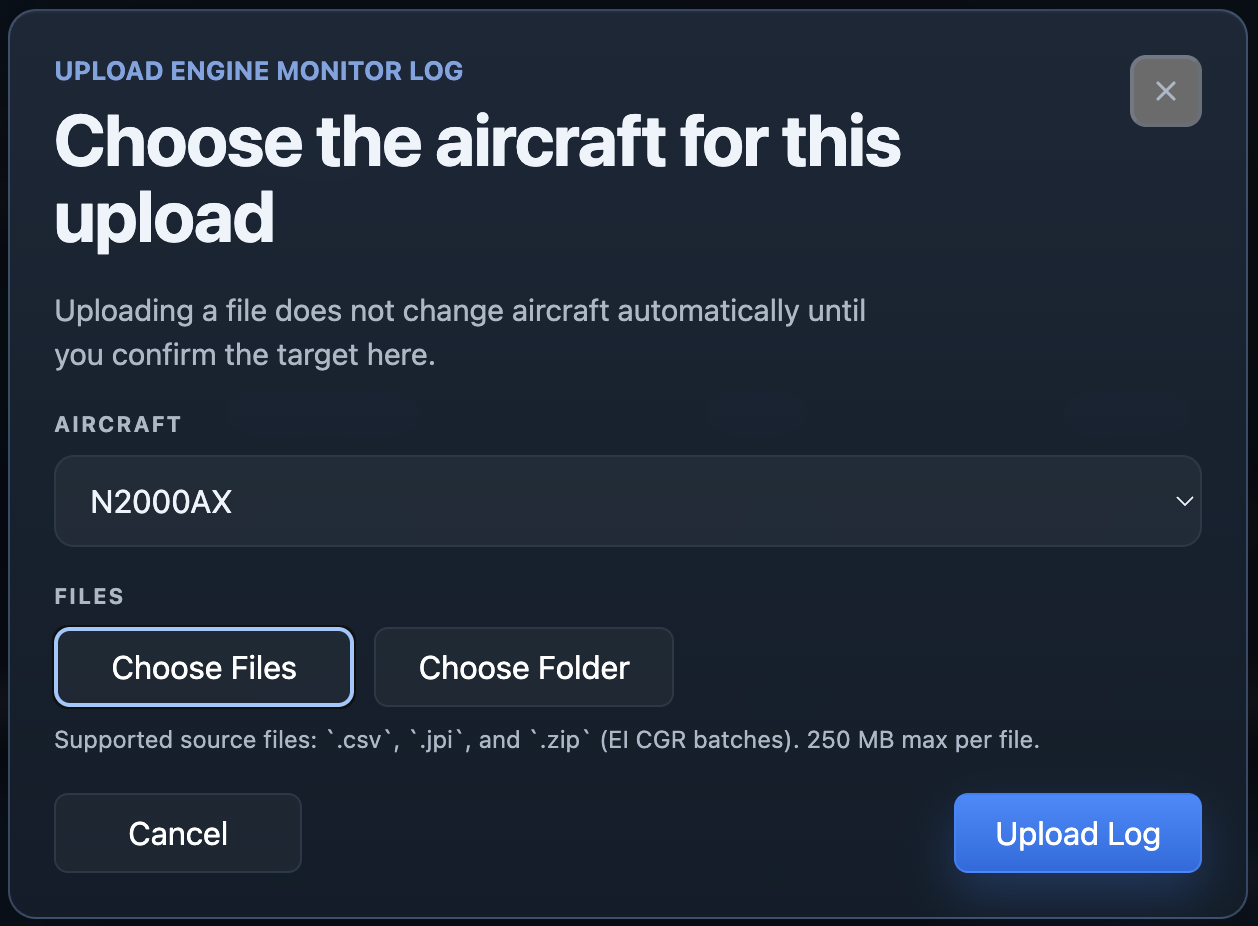
Step 2
Start by choosing the aircraft, then select the file, folder, or supported zip export from the engine monitor. After import, confirm the parsed flight details before reading the review.
The imported flight should show a plausible date, duration, aircraft tail, monitor source, and channel set. If those are wrong, fix that before reading health cards.
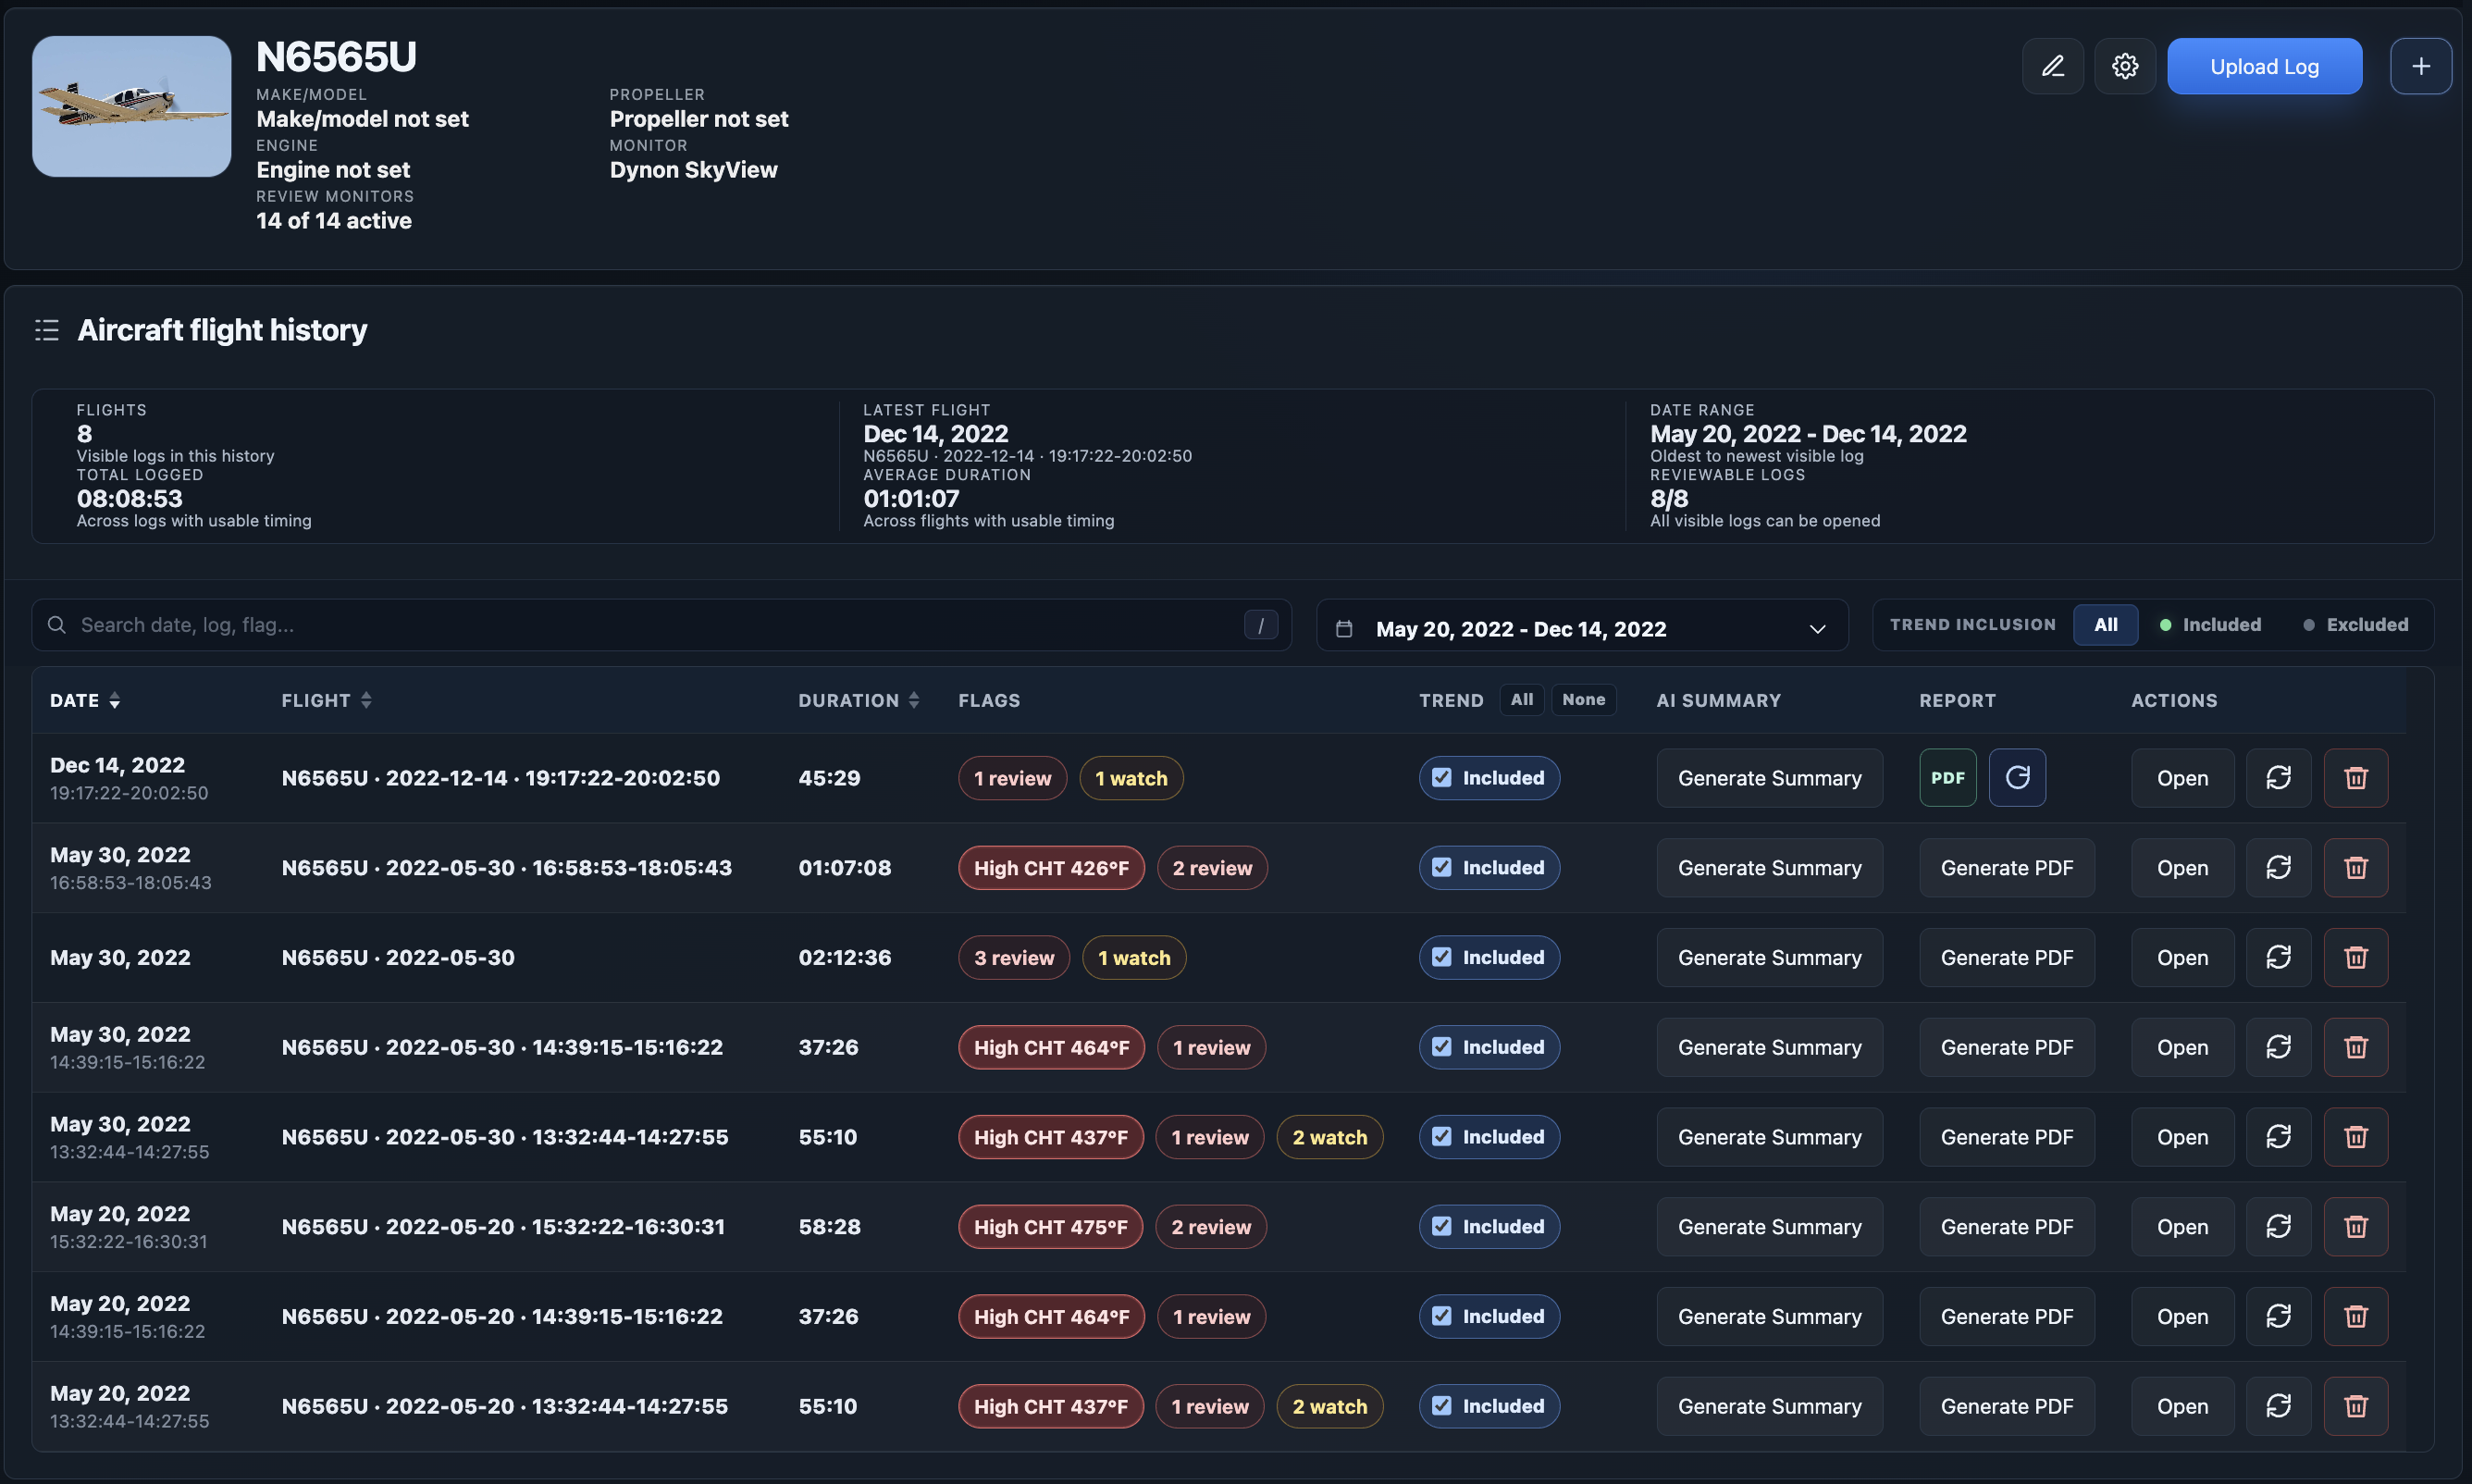
Step 3
After the log has imported, use the Flights page as the review queue. This is where you confirm the available logs for the aircraft and choose the exact flight before opening the Dashboard review.
Use the row details as a quick sanity check: aircraft, date, duration, monitor source, analysis status, and report actions should all match the flight you intend to inspect.
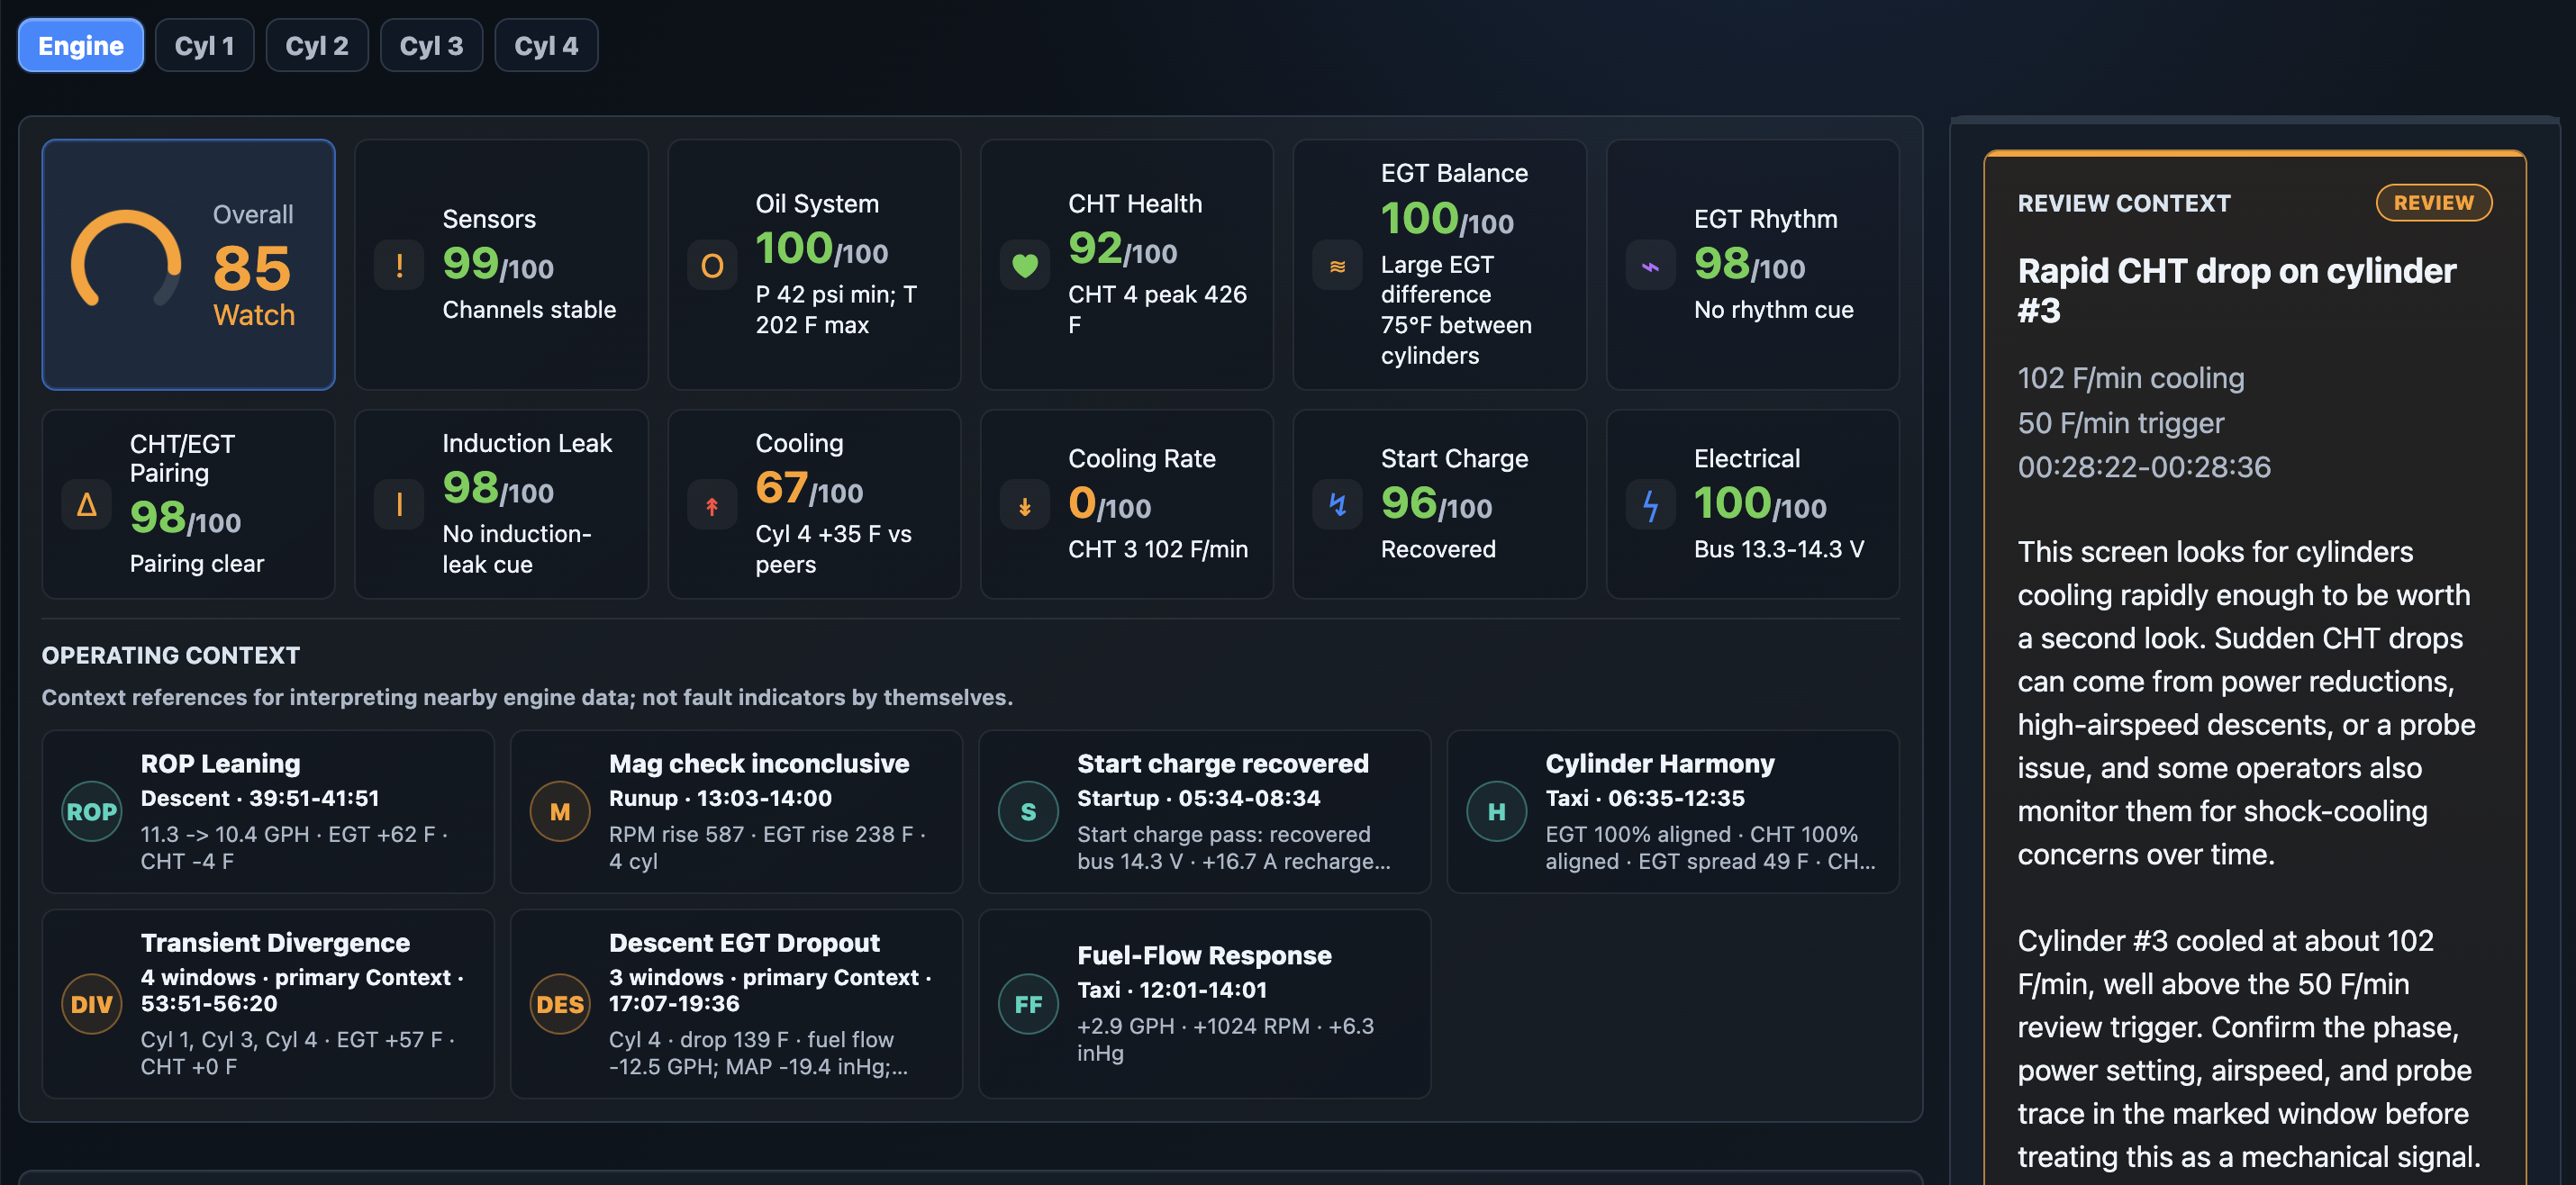
Step 4
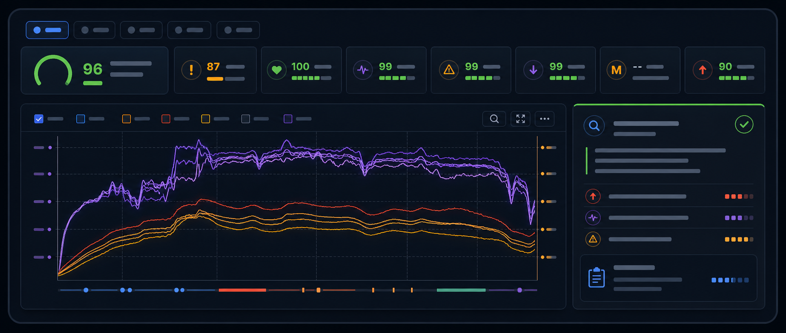
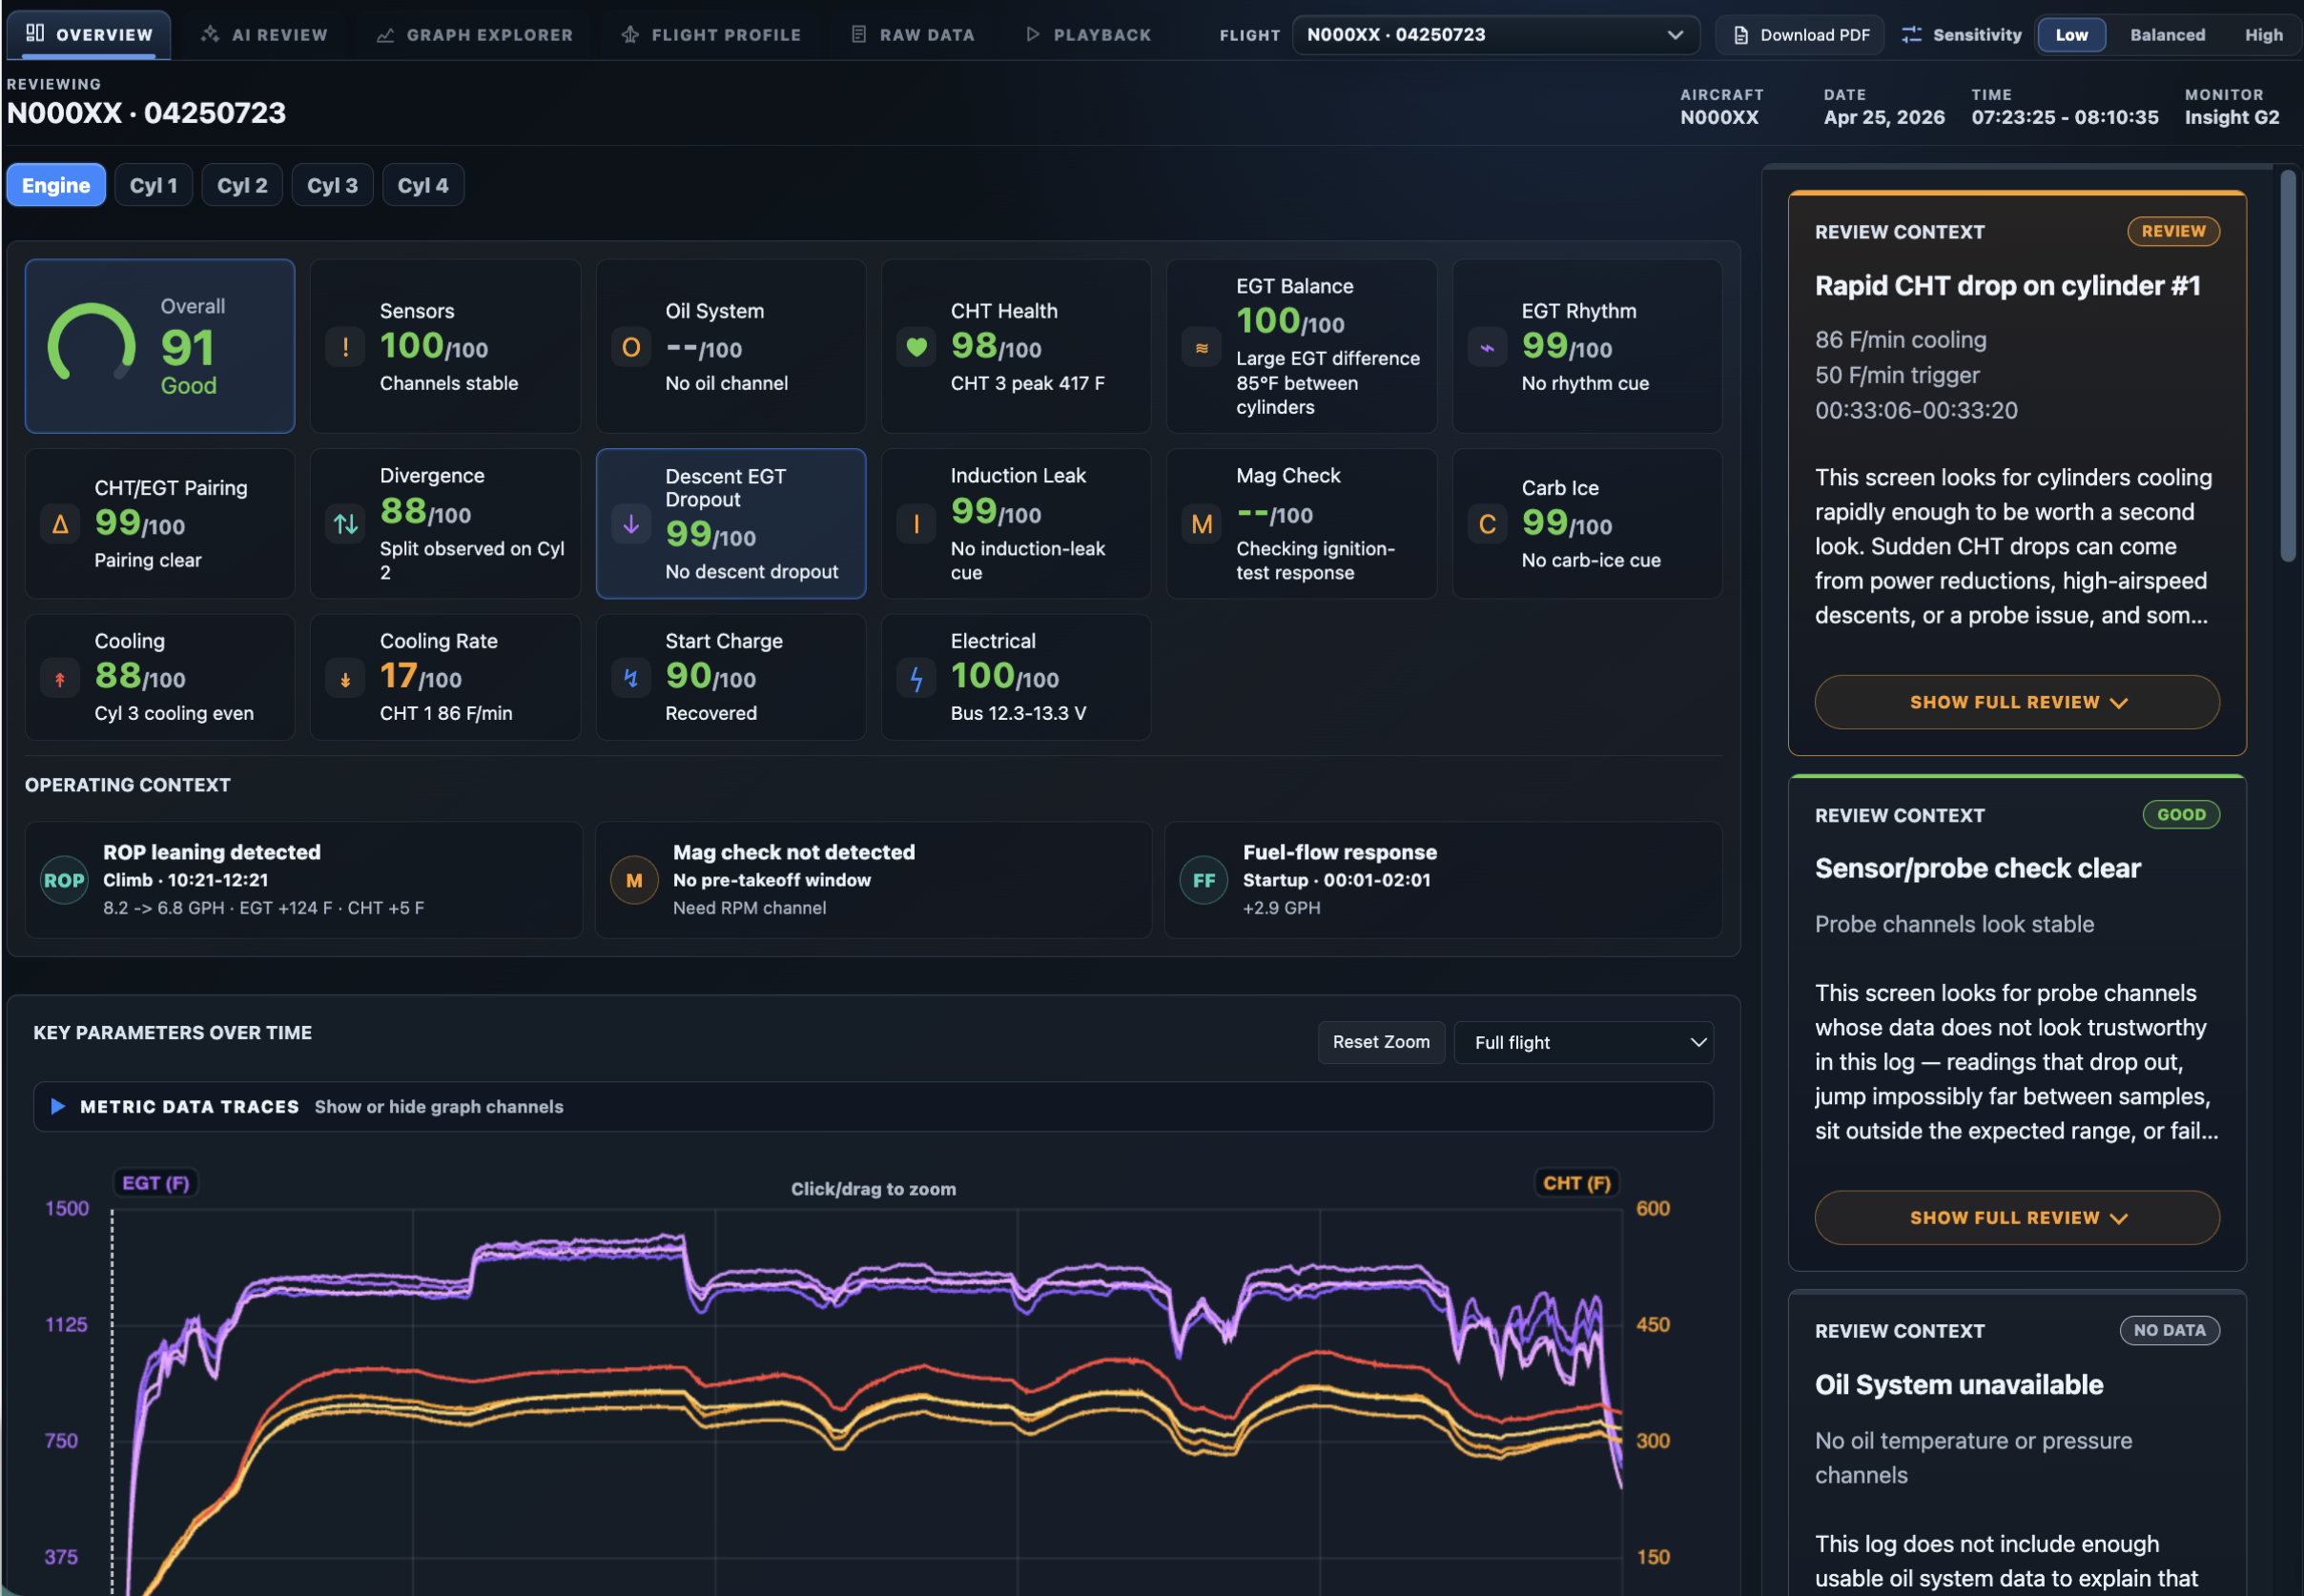
The Overview page is dense on purpose. Treat it like a post-flight review sheet: first confirm what flight you are looking at, then scan priorities, then inspect evidence.
Use the selected-flight row to confirm aircraft, date, monitor source, and duration. Scope controls switch between overview and deeper review modes when available.
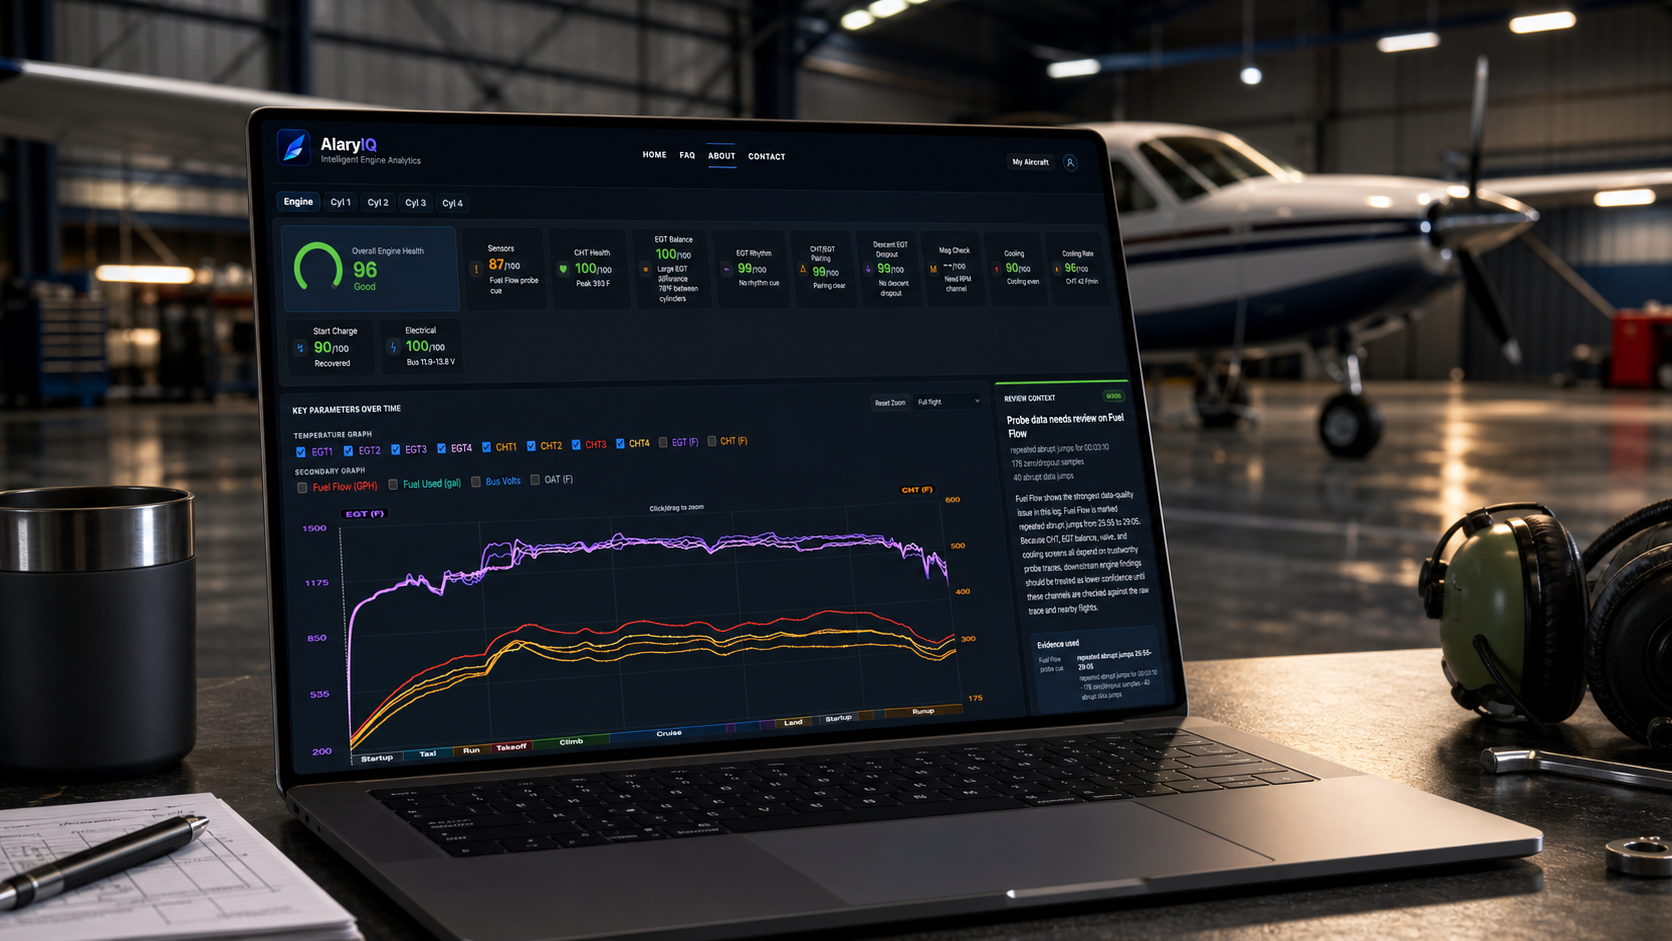
Cards rank where to look first: Sensors, Oil, CHT, EGT Balance, EGT Rhythm, Cooling, Electrical, and other enabled monitors. They are triage cues, not diagnoses.
Context cards identify things such as ROP/LOP operation, power changes, or pattern work. These can explain why a temperature movement is normal or suspicious.
The graph is the evidence panel. Use it to confirm whether a card reflects a real pattern, a short transient, a phase-specific event, or noisy data.
This panel explains the selected finding, possible causes, confidence, and supporting evidence. Read it after you have looked at the graph.
Use cylinder detail to see whether CHT and EGT behavior belongs to one cylinder, a pair, one engine side, or the whole engine.
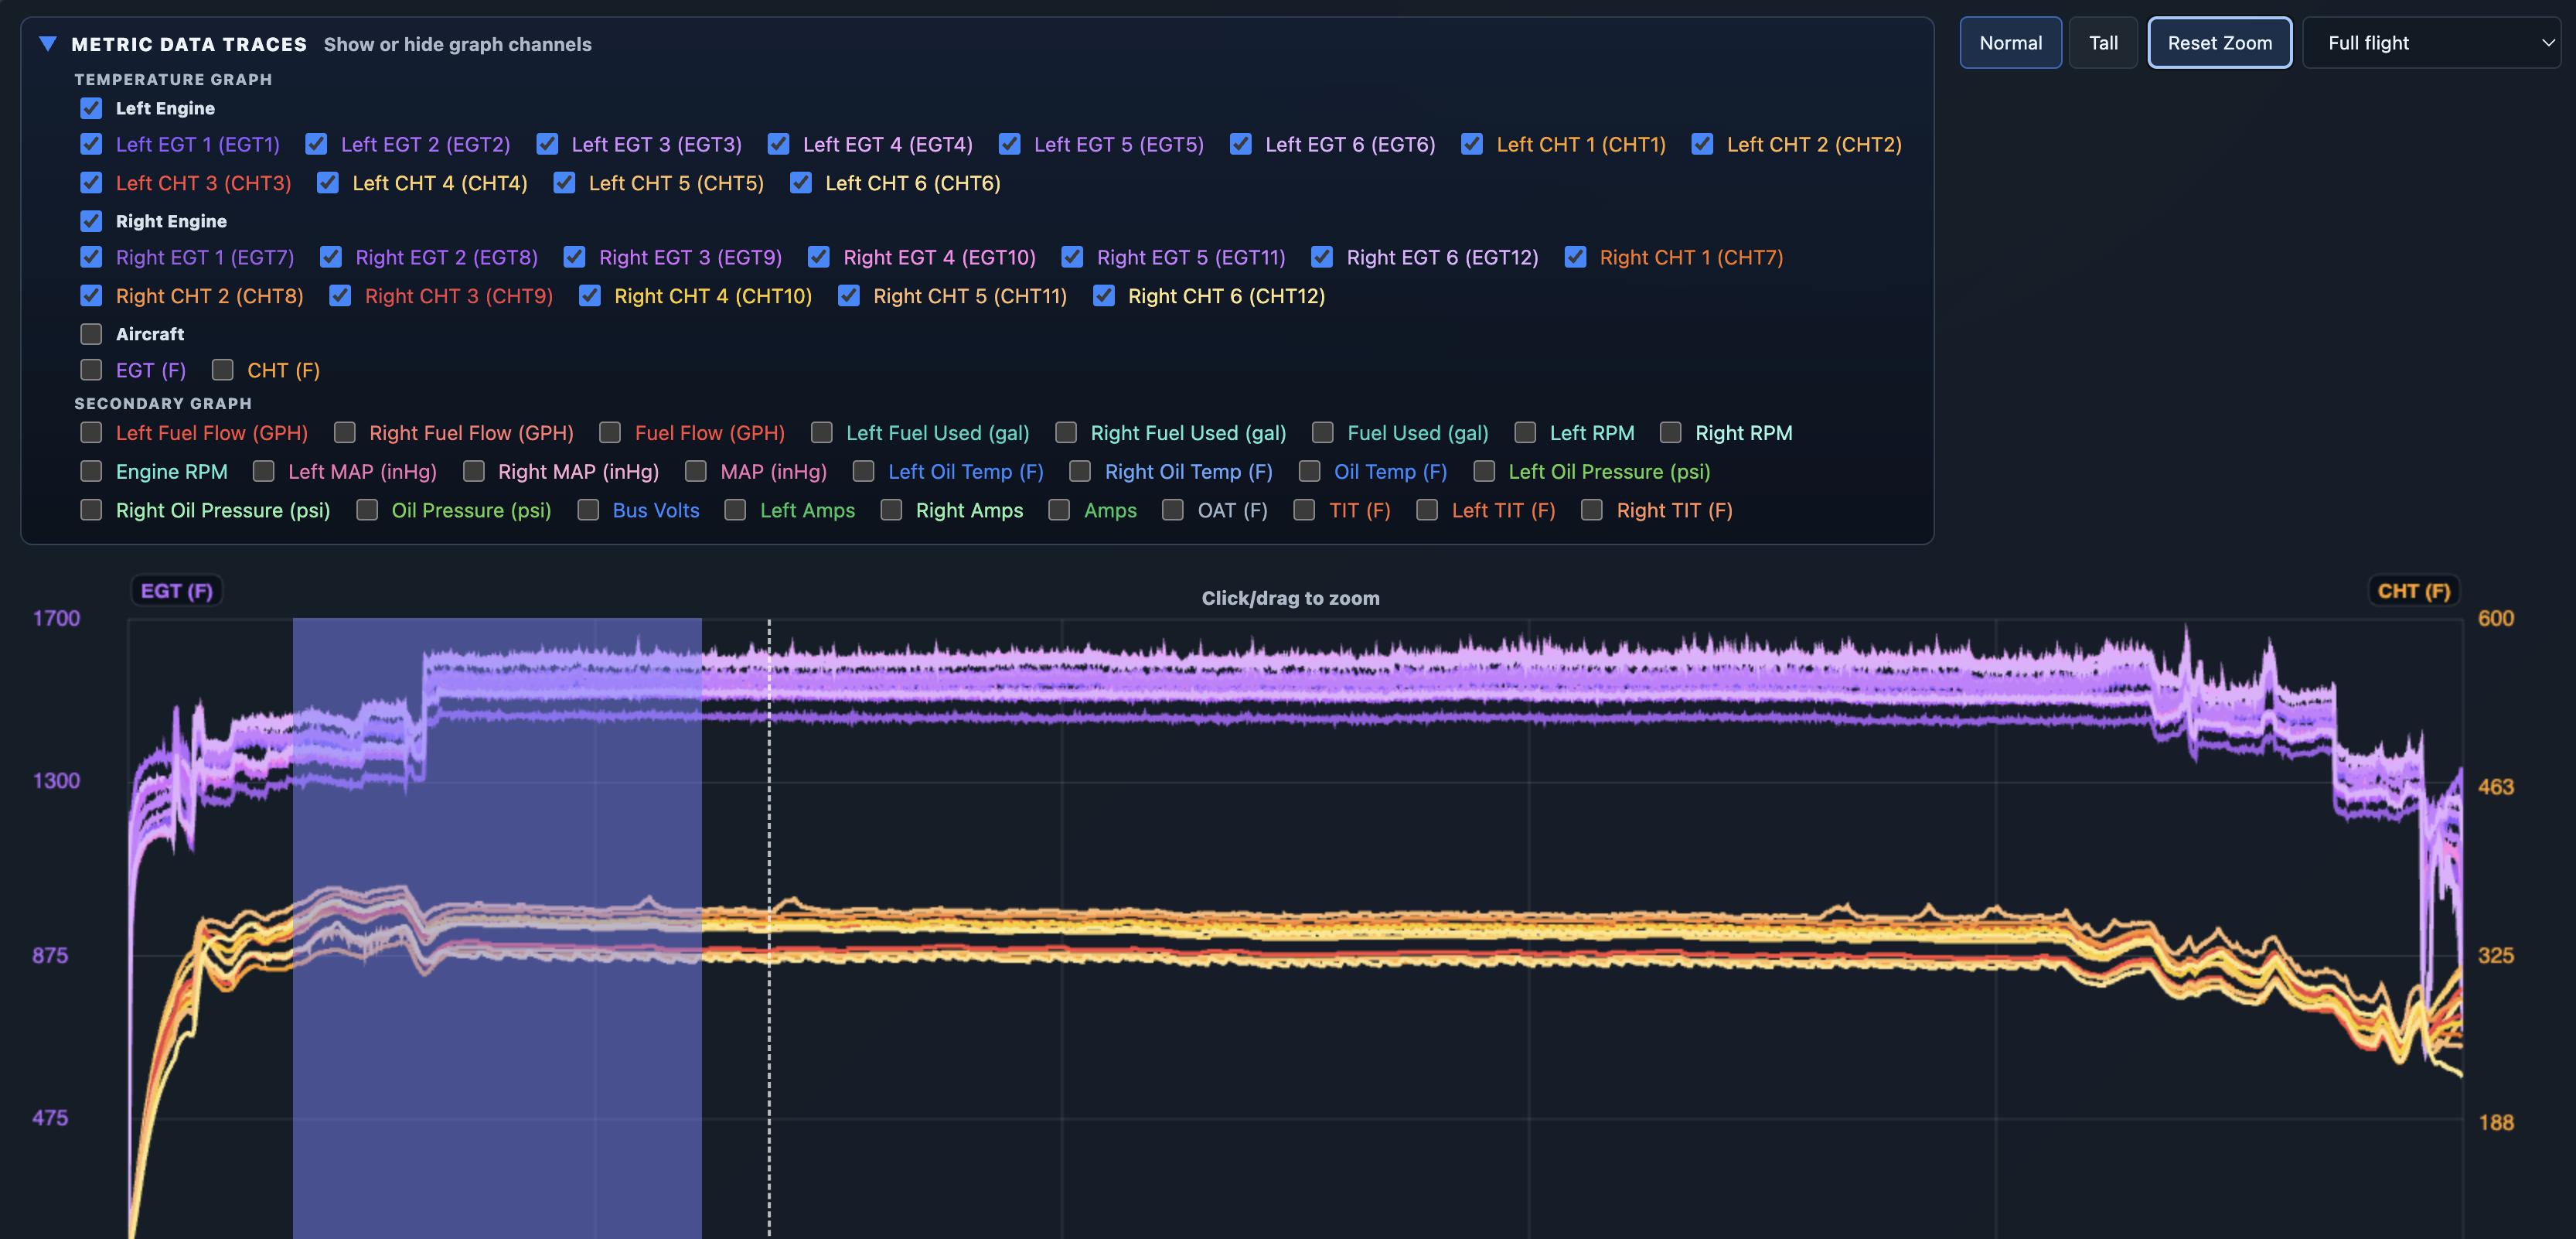
Step 5
Do not stop at the score card. The graph is where you check whether a finding makes sense in time, phase, and sensor context. The goal is to narrow the view until the important traces are readable, then compare what changed before, during, and after the window.
Instead of asking “why is this card amber?”, ask “during this phase, did the flagged sensor move by itself, or did related power, mixture, temperature, or electrical traces move at the same time?”
Step 6
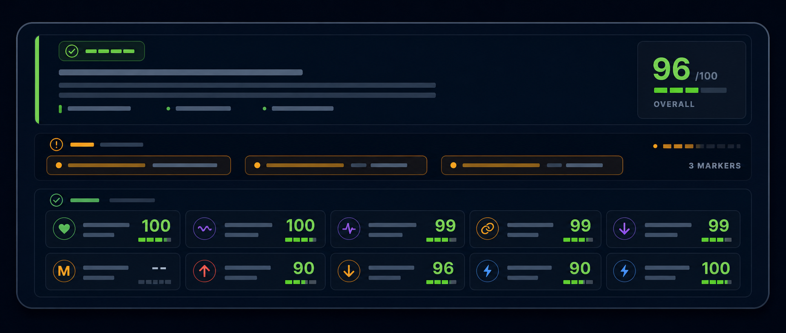
A finding is a prompt to inspect evidence. The strongest findings usually have a clear time window, visible trace behavior, phase context, and enough clean data to support confidence.
The title names the review cue. Severity tells you how quickly to look, not what maintenance action to take.
Cause percentages are ranked hypotheses. Use them to guide inspection questions, not as final answers.
Confidence depends on signal strength, phase context, and sensor quality. Low confidence means review carefully.
Expand the finding when you need the longer explanation, supporting windows, and related flights.
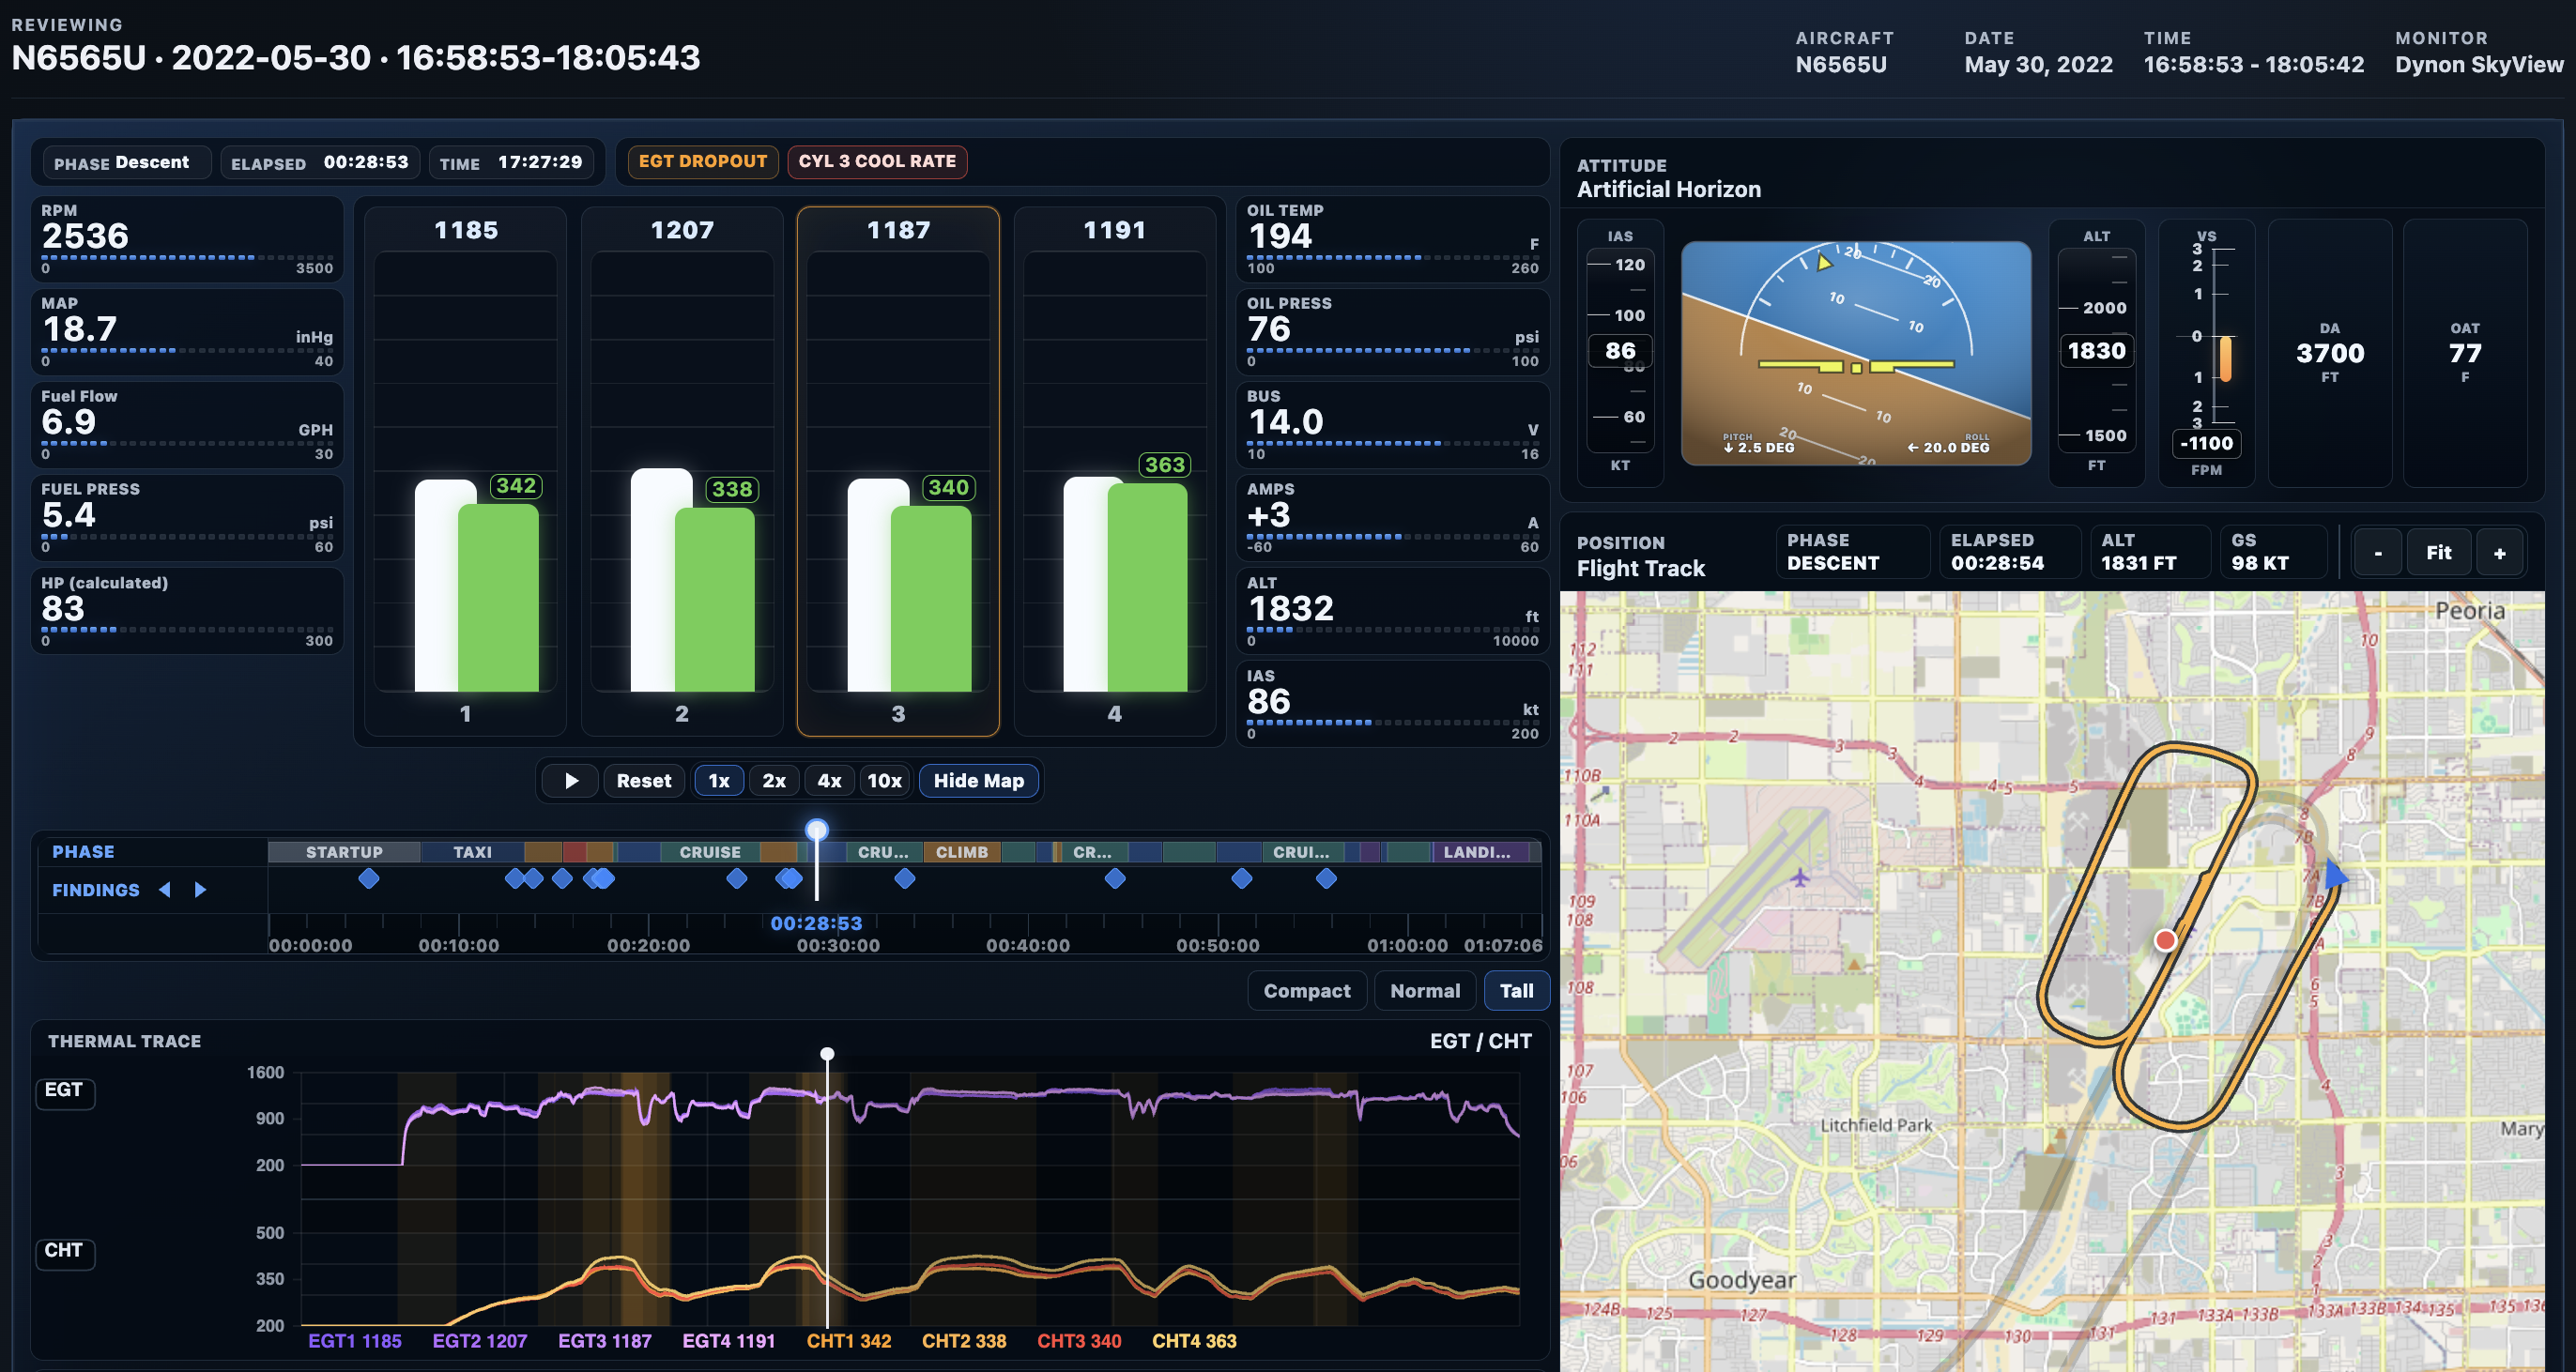
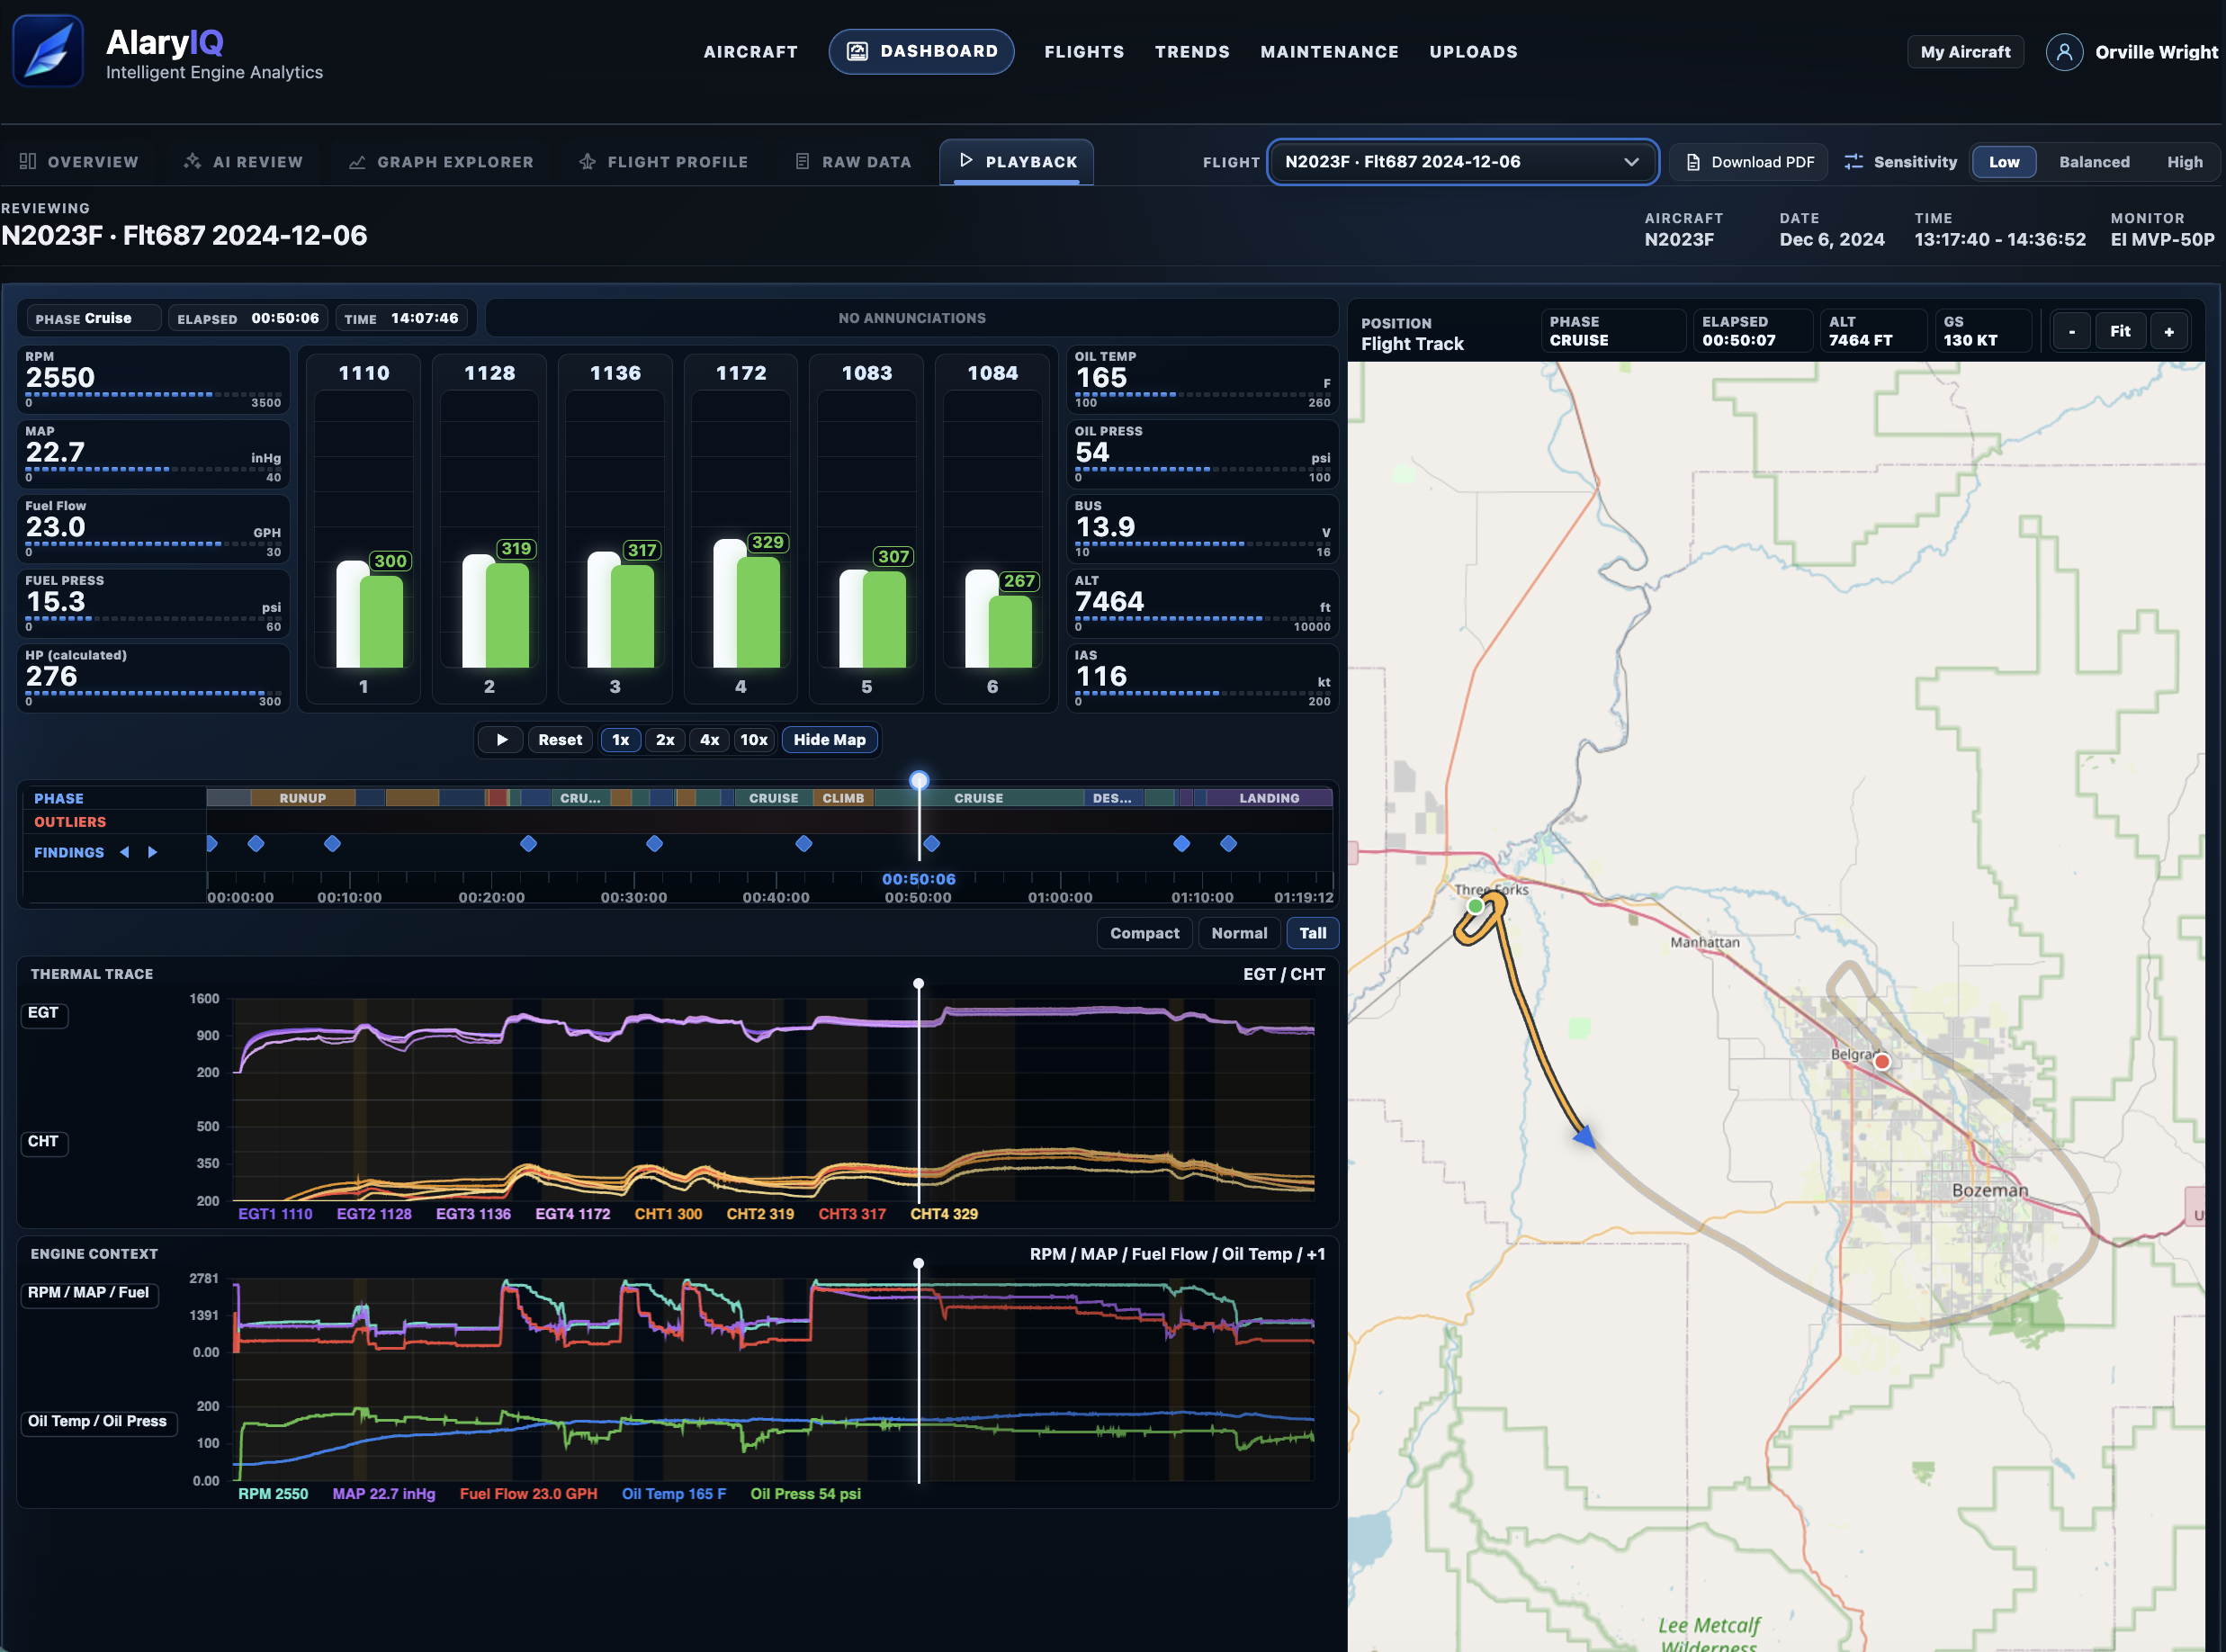
Step 7
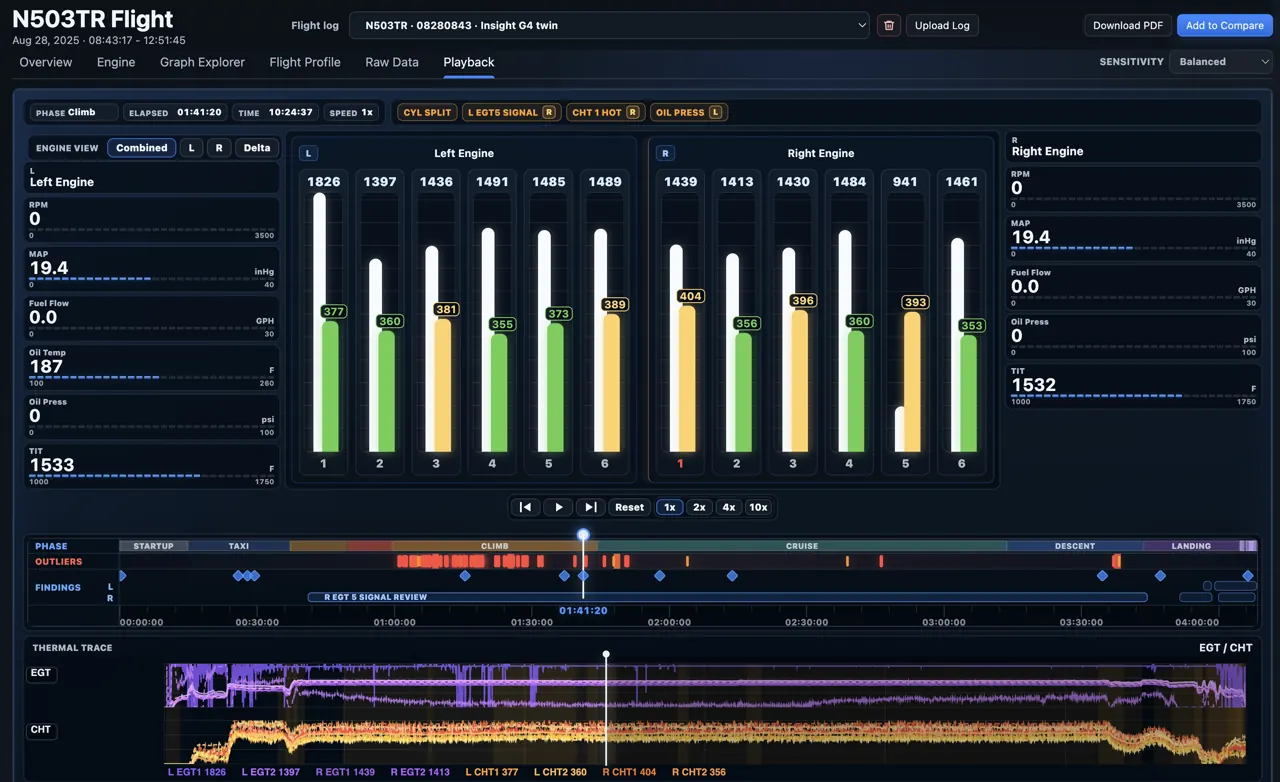
Playback is useful when you want to review engine data in a format that feels closer to how pilots experience the flight. Instead of reading only chart traces, you can replay the log alongside familiar instrument-style displays and position context.
Use Playback when the question depends on pilot context: takeoff flow, climb behavior, descent setup, maneuvering, position over the ground, or whether engine changes line up with flight-state changes.
Step 8
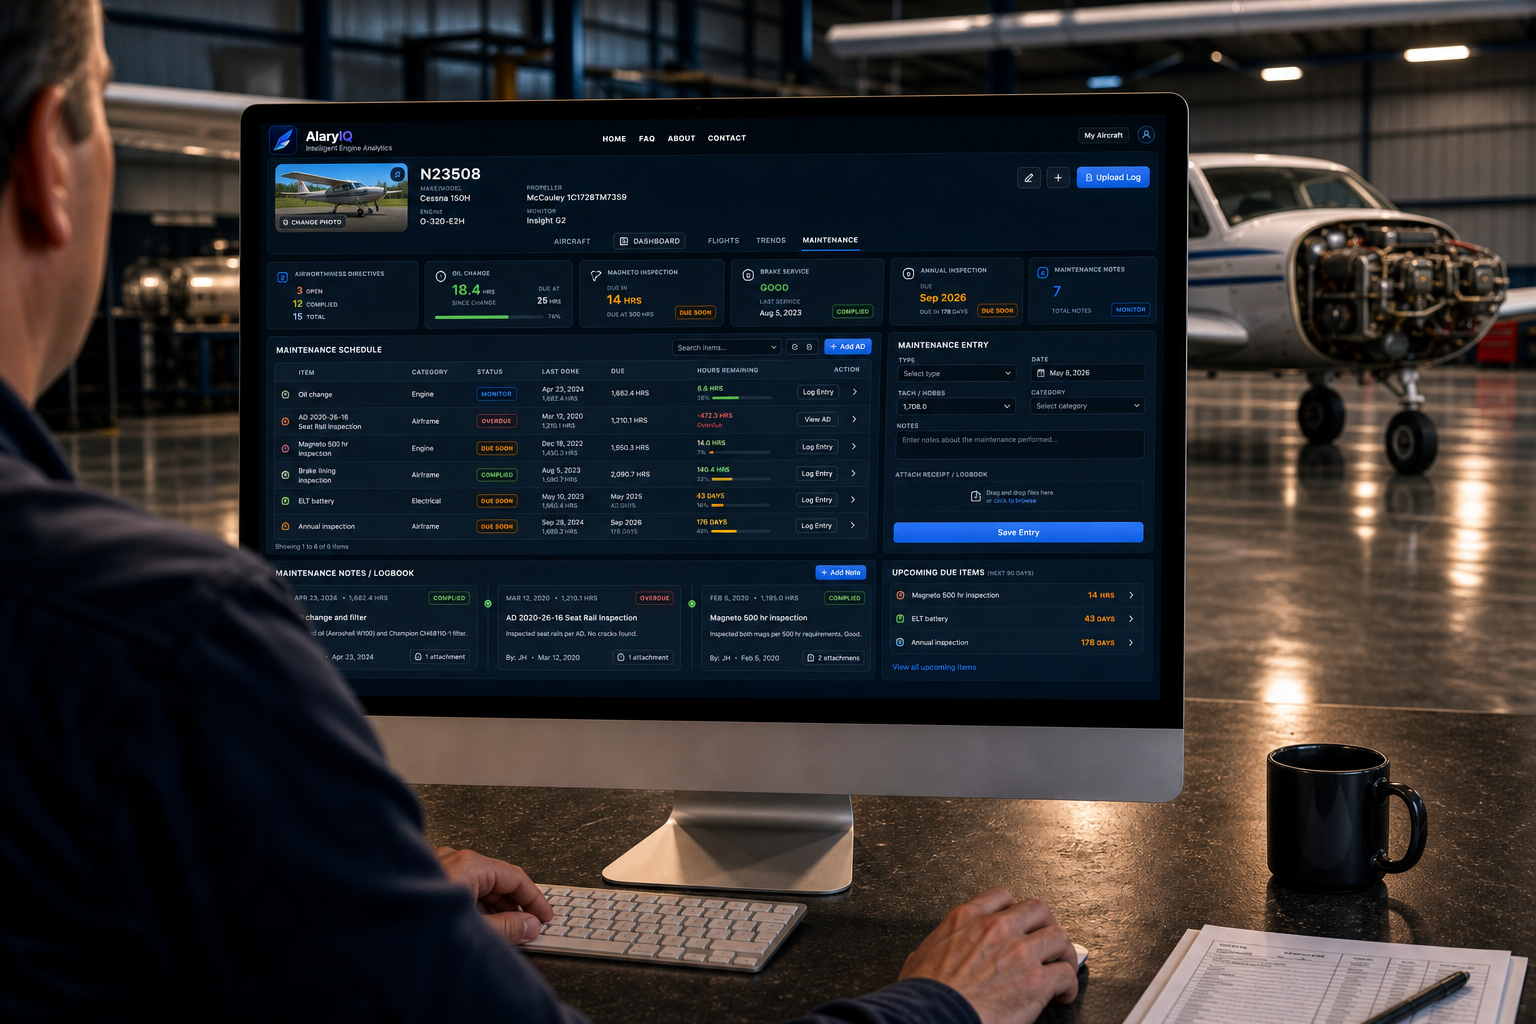
After reviewing one flight, move to the other workspace pages to manage history, check repeated behavior, and organize follow-up work.
Step 9
Once you have checked the dashboard cards, graph evidence, findings, and flight context, generate a PDF report to share the review in a format that is easier to discuss, save, or attach to maintenance records.
Treat the PDF as an evidence packet for a maintenance conversation. It organizes findings, context, charts, and advisory notes, but it does not determine airworthiness or replace inspection, logbooks, service data, or mechanic judgment.
AlaryIQ turns engine-monitor logs into readable review notes, grounded in the traces, phases, and data quality behind each cue.
Engine monitor exports contain a lot of truth, but not much explanation. AlaryIQ organizes temperatures, fuel flow, electrical behavior, flight phases, and sensor confidence into a clearer story of how the engine operated.
AI, held accountable
AlaryIQ does not simply feed raw engine-monitor logs into AI and ask for an opinion. Each flight is first reviewed by deterministic detectors that look for defined patterns in phase of flight, sensor quality, CHT, EGT, cooling behavior, oil, electrical, fuel flow, cylinder trends, and other review cues.
Those detector outputs become a structured evidence packet. The AI Analysis Summary is generated from that packet, not from raw rows alone, so the summary stays grounded, repeatable, and advisory.
Defined checks identify operating context, data quality, anomalies, and review cues.
The evidence packet carries findings, windows, confidence, and caveats forward.
AI turns bounded evidence into plain English without becoming the source of truth.
The detectors are the harness. The AI is the translator.
Import engine-monitor logs in common formats. We never alter your data.
We sync time, standardize units, and flag data quality issues so you know what is reliable.
AlaryIQ runs each log through over 20 detection algorithms to surface anomalies, data-quality concerns, and other important review cues within phase context and benchmarks.
Generate clear review notes with traces, context, and quality indicators as a PDF or shareable link. Share with confidence.
AlaryIQ helps turn engine data into clearer review context while keeping inspection, records, and maintenance decisions where they belong: with qualified people.
Every cue should point back to the measured behavior, time window, and source channel behind it.
Climb, cruise, descent, and ground operations are treated differently because engines are operated differently.
The product supports experienced review; it does not approve maintenance, determine airworthiness, or replace documentation.
Use AlaryIQ to organize the review conversation around what the data actually shows, what context matters, and what a qualified person should inspect next.
Contact
Fill out the form below to hear about app updates, supported monitor formats, and early access opportunities as they become available.
Share a few details so future updates can be useful: what you fly, what monitor you use, and what you want AlaryIQ to help you review.
Terms of Use
These terms are intended for a browser-based aircraft engine-monitor analysis app that turns uploaded log data into advisory review notes, charts, and reports. By using AlaryIQ, you agree to use the app responsibly and to verify all information before making aviation, operational, or maintenance decisions.
AlaryIQ provides automated data review, trend summaries, visualizations, and report language based on the data available to the app. The results, flags, scores, summaries, charts, exports, and reports are informational screening aids only.
They are not a diagnosis, airworthiness determination, maintenance release, repair instruction, inspection finding, conformity statement, or substitute for professional judgment.
Nothing in AlaryIQ authorizes, clears, approves, dispatches, or recommends operation of any aircraft. You remain solely responsible for determining whether an aircraft may be operated, maintained, inspected, repaired, returned to service, or grounded.
Always follow applicable regulations, aircraft manuals, engine and component manufacturer guidance, operating limitations, maintenance records, inspection requirements, and the judgment of appropriately qualified aviation professionals.
You are responsible for the accuracy, completeness, ownership, and lawful use of any files, aircraft information, maintenance notes, or other content you upload or enter. You agree not to rely on AlaryIQ as the sole basis for operational, safety, maintenance, financial, insurance, regulatory, or legal decisions.
You should review source data, confirm aircraft configuration, investigate data-quality warnings, and consult qualified mechanics, inspectors, pilots, or other appropriate professionals before acting on any result.
Engine monitor logs can be incomplete, misconfigured, mislabeled, corrupted, sampled at different rates, affected by sensor faults, or missing important operational context. AlaryIQ may produce incorrect, incomplete, delayed, or misleading outputs if the source data or assumptions are wrong.
Reports may use estimated, inferred, or simplified context. Any comparison, trend, threshold, flag, confidence statement, or suggested follow-up must be checked against the actual aircraft, maintenance history, operating environment, and applicable documentation.
You agree to use AlaryIQ only for lawful purposes and in a way that does not interfere with the app, attempt unauthorized access, upload malicious content, misrepresent report meaning, or use the service to create unsafe or deceptive aviation advice.
AlaryIQ does not provide aircraft maintenance, engineering, inspection, flight instruction, operational control, regulatory compliance, legal, insurance, or medical services. Any examples, notes, or possible next steps are general review prompts, not professional instructions.
The app may change, add, remove, or modify features, supported formats, thresholds, scoring, report wording, storage behavior, or availability at any time. We may update these terms as the product develops.
AlaryIQ is provided as available and without warranties of accuracy, fitness for a particular purpose, uninterrupted operation, regulatory compliance, or suitability for any specific aircraft, engine, monitor, operation, or maintenance decision.
To the fullest extent permitted by law, AlaryIQ and its providers are not liable for losses, damages, costs, claims, delays, aircraft downtime, maintenance expenses, operational decisions, safety outcomes, or other consequences arising from use of, inability to use, or reliance on the app or its outputs.
Privacy Policy
This policy describes common privacy practices for an aircraft engine-monitor analysis app. AlaryIQ processes aircraft, flight, engine-monitor, account, and support information so users can review uploaded logs, generate advisory reports, and manage aircraft-level history.
We may collect information you enter or upload, including name, email address, aircraft identifiers or labels, aircraft make and model, engine and monitor details, maintenance notes, contact requests, comments, and uploaded engine-monitor files.
You should avoid uploading information you do not have permission to use or share.
Uploaded logs may include timestamps, flight phases, engine temperatures, fuel flow, oil data, electrical values, GPS-derived fields, altitude, speed, and other monitor channels. Reports and analysis artifacts may summarize, transform, or derive additional review data from those files.
We use information to operate the app, parse and normalize uploads, generate charts and reports, maintain aircraft histories, improve supported monitor formats, respond to support requests, detect errors, protect the service, and develop product features.
Generated results and reports are part of your app data. They may contain aircraft identifiers, source-file details, engine measurements, review cues, confidence notes, and suggested follow-up prompts. Treat exported reports as records you control and share carefully.
We may store uploaded files, parsed data, generated artifacts, reports, preferences, and aircraft profiles for as long as needed to provide the app, maintain records, satisfy legal obligations, resolve disputes, enforce terms, or support backup and recovery workflows.
We do not sell personal information. We may share information with service providers that help operate hosting, storage, analytics, email, security, support, or AI-assisted features. We may also disclose information if required by law, to protect rights or safety, or as part of a business transfer.
We may anonymize, remove, mask, or separate personal information and direct aircraft identifiers from uploaded or derived data. This may include removing or obscuring names, addresses, contact information, account details, aircraft N numbers, tail numbers, and other identifying fields.
After that process, we may use, sell, license, publish, or otherwise commercialize de-identified engine-monitor data, normalized data, trend data, derived metrics, aggregate statistics, and related analysis outputs for research, benchmarking, product development, training, analytics, or commercial purposes.
If AI-assisted summaries or report text are enabled, relevant aircraft, flight, evidence, or report context may be sent to model providers or infrastructure providers to generate the requested output. Do not submit sensitive information unless you are comfortable with that processing.
The app may use browser storage, cookies, or similar technologies to remember preferences, selected aircraft, hidden flights, review settings, session state, and performance or diagnostic information.
We use reasonable administrative, technical, and organizational safeguards for the information we handle. No system is perfectly secure, and you are responsible for protecting your device, account credentials, exported reports, and shared files.
You may request access, correction, deletion, or export of your information where applicable. Some data may be retained when needed for security, legal compliance, backups, dispute resolution, or legitimate business records.
AlaryIQ is not intended for children. Do not use the app or submit information if you are not old enough to agree to these terms under applicable law.
We may update this policy as the product, legal requirements, or data practices change. Continued use of the app after an update means you accept the updated policy.
Detection Guide
Reference for how AlaryIQ detections work, what they look for, and how to evaluate them in context.
Reading the detection guide JSON.
Upload a flight log to populate this aircraft's dashboard.
Overall
-- LoadingSensors
--/100 Checking probe qualityTurbo/Boost
--/100 Checking boost and TIT contextOil System
--/100 Checking oil temp and pressureCHT Health
--/100 Analyzing CHT dataEGT Balance
--/100 Checking EGT balanceEGT Rhythm
--/100 Checking EGT stabilityCHT/EGT Pairing
--/100 Pairing CHT and EGT movementDivergence
--/100 Checking transient cylinder splitDescent EGT Dropout
--/100 Checking low-power descent EGT dropsInduction Leak
--/100 Checking lean power-loss cuesMag Check
--/100 Checking ignition-test responseCarb Ice
--/100 Checking carb-temp/OAT power cuesCooling
--/100 Comparing CHT to power and airflowCooling Rate
--/100 Checking CHT drop rateStart Charge
--/100 Checking start recoveryElectrical
--/100 Analyzing bus voltageKey Parameters Over Time
Cylinder Detail
Engine Triage
Primary finding
Review queue
Cylinder Detail
Flight Profile
Special Tests
Raw Data
Channel Inventory
| Channel | Unit | Min | Avg | Max | Missing | Scoring |
|---|
Data Quality
Parsed Rows Preview
Fleet Click/drag to reorder aircraft
| Flags | Trend | AI Summary | Report | Actions |
|---|
| Raw file | Status | Flights | Latest job | Size | Uploaded | Hash | Action |
|---|
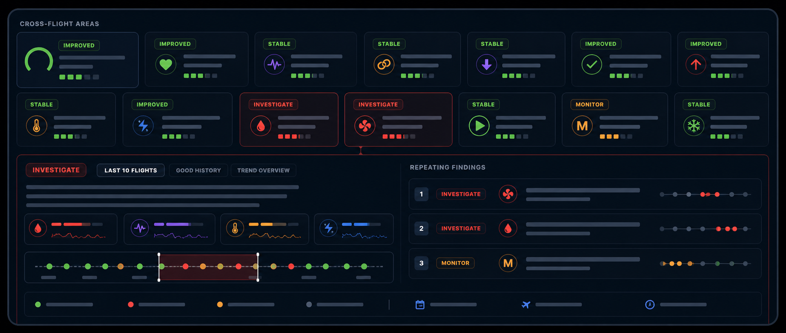
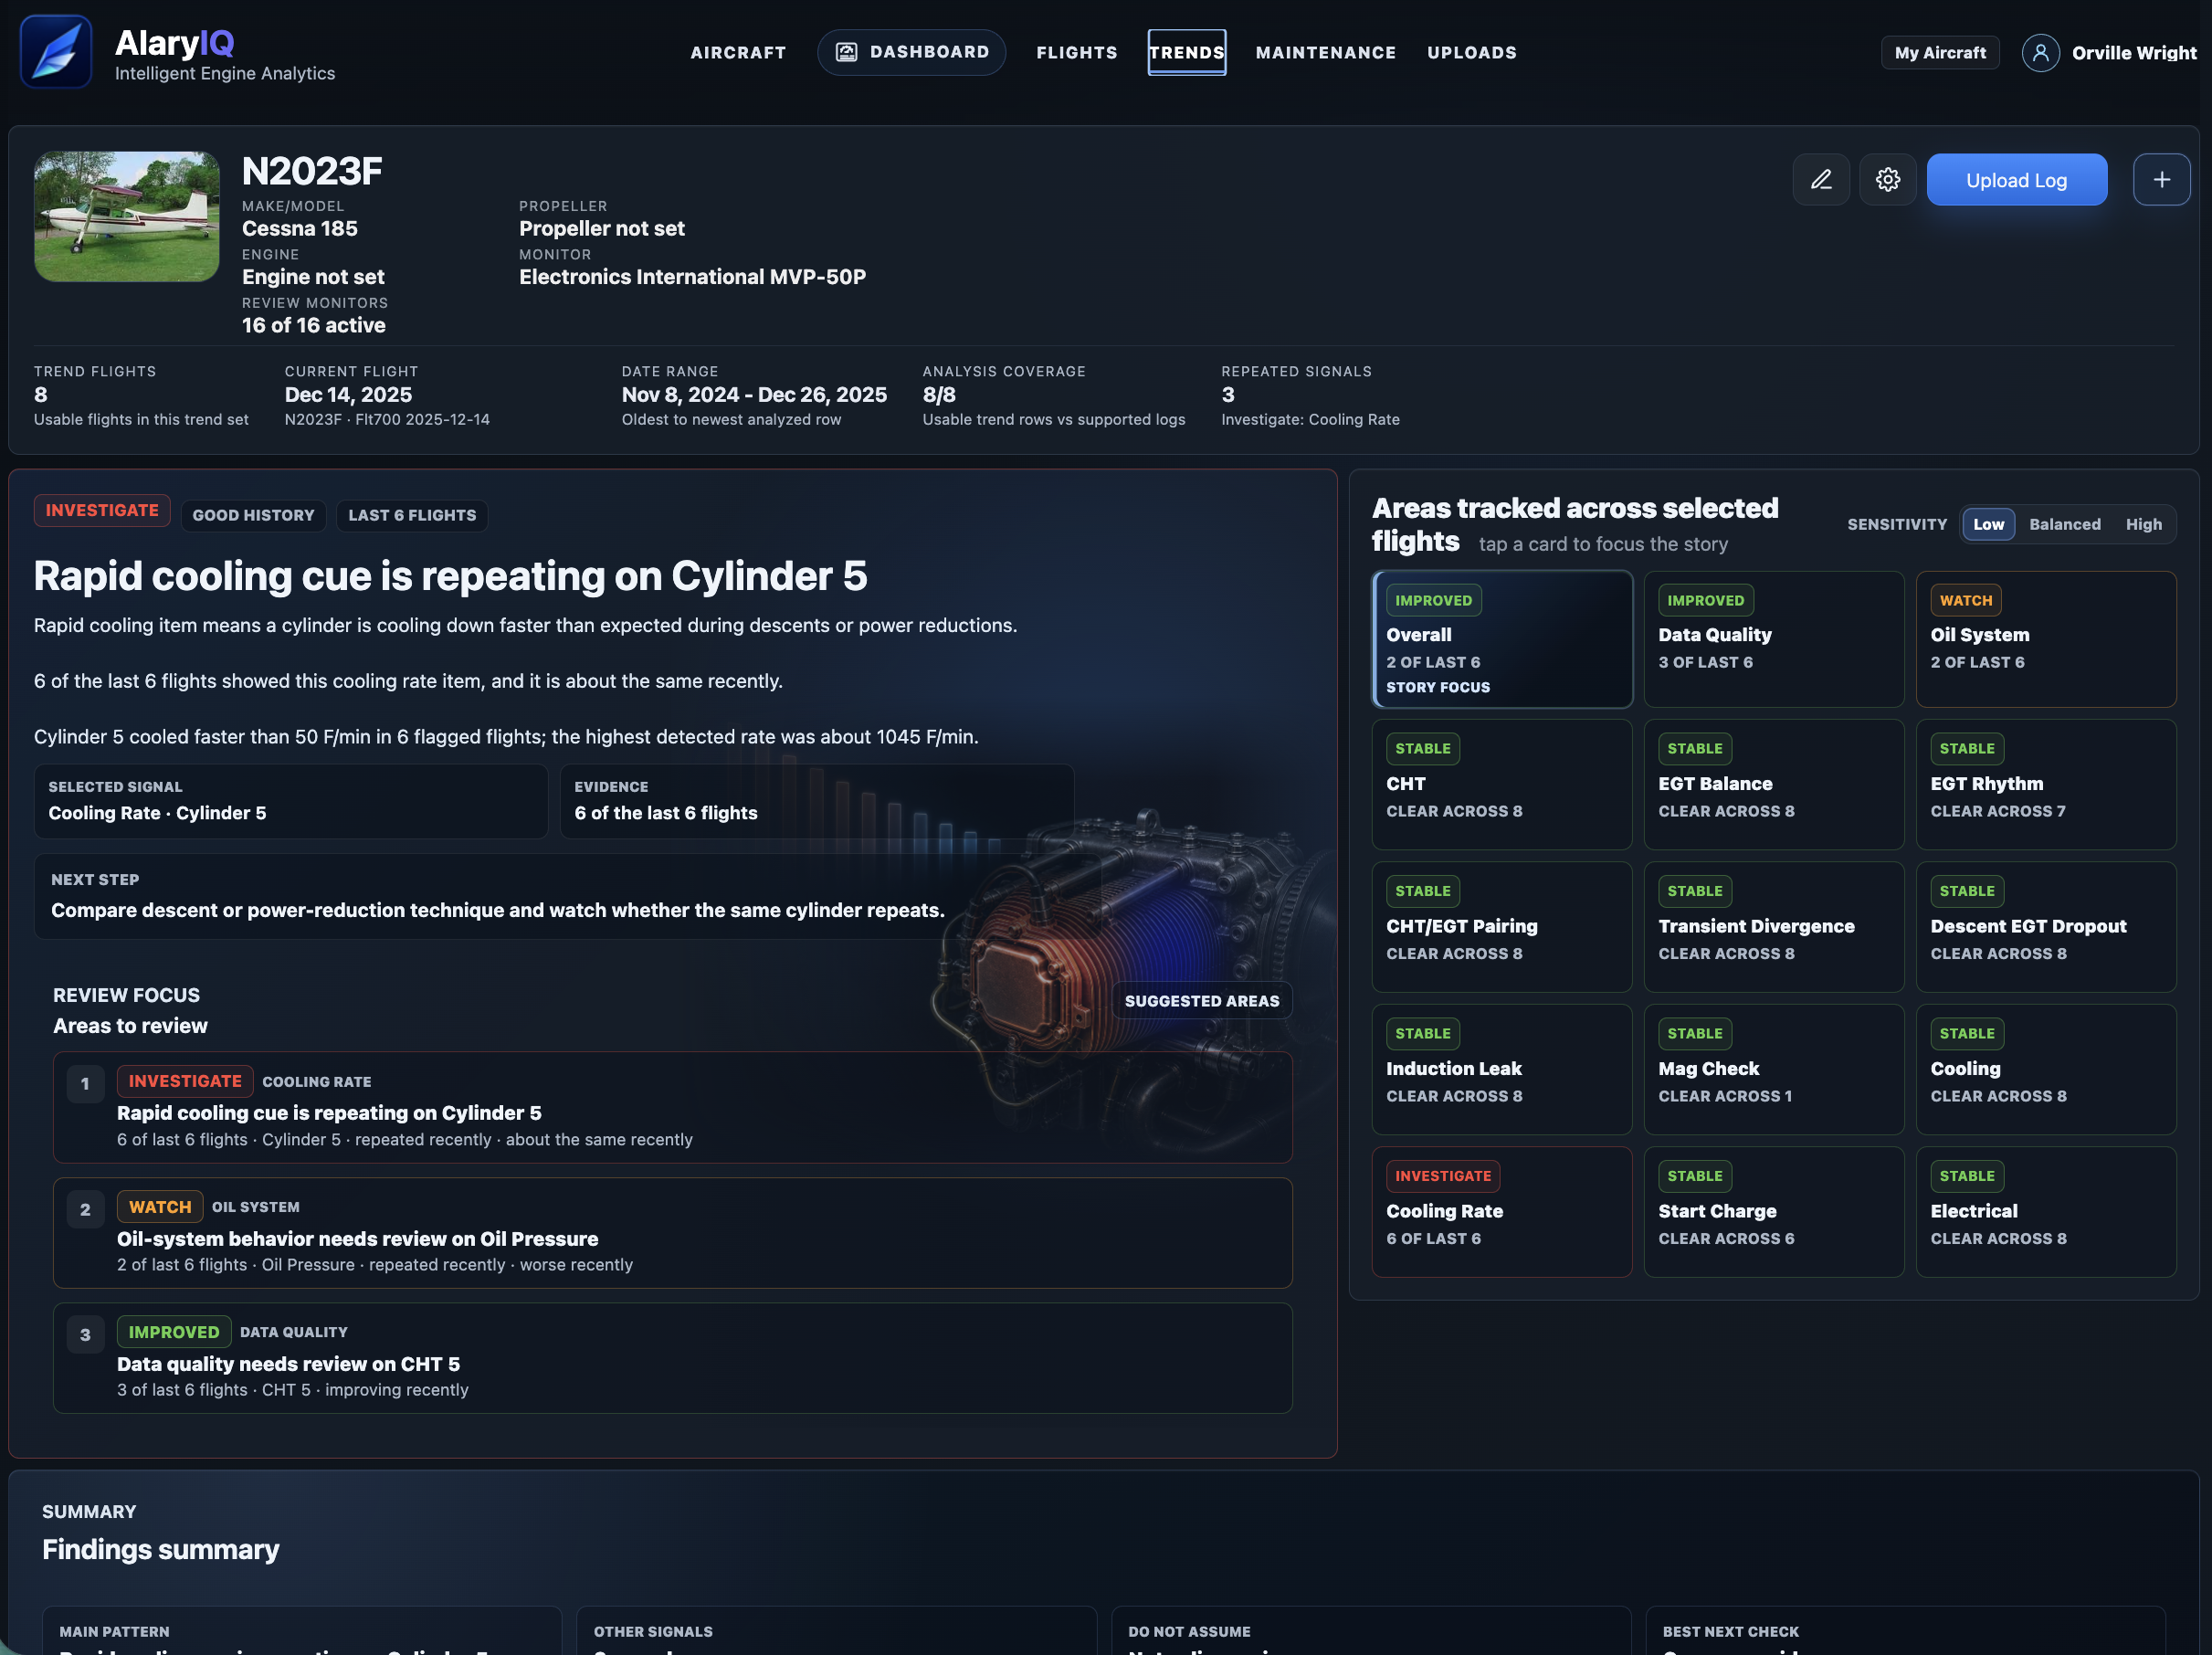
Choose an area below to see what has changed across this aircraft's recent flights.
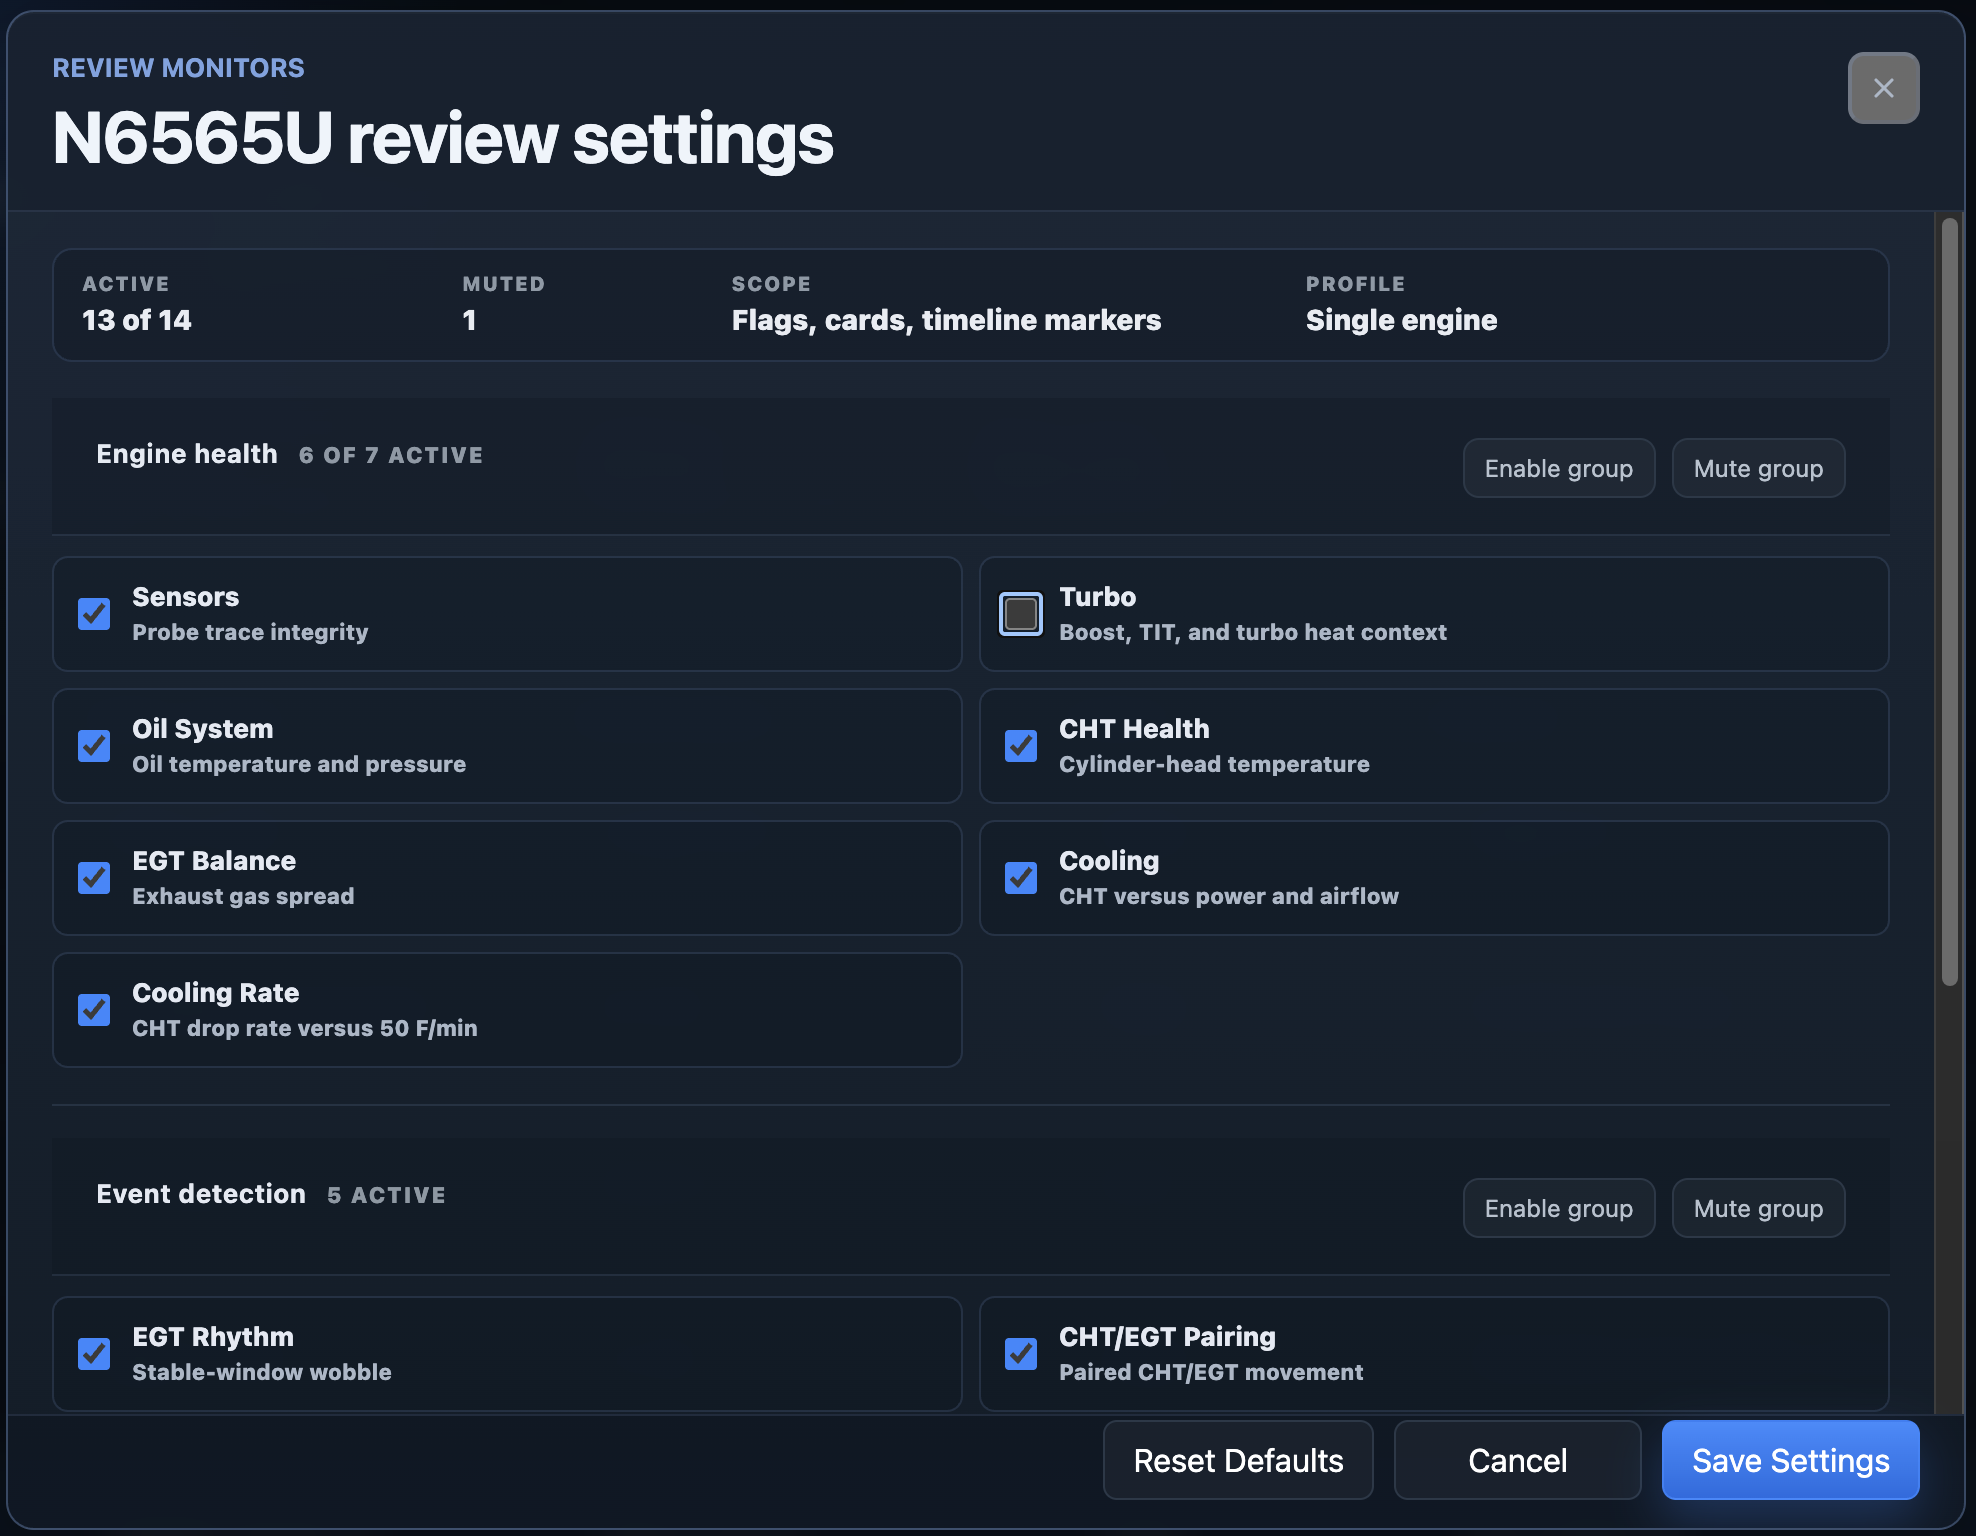
Review Focus
Summary
Summary text will appear here after trend findings are available.
GAMI Aggregate
Sample Flights
Representative flight traces will appear here when a repeating item is found.
Flights
Scores are out of 100; higher is healthier. -- means that check did not have enough data for the flight.
| Date | Flight | Overall | Turbo | CHT | EGT | Valve | CHT/EGT | Div. | Dropout | Ind. Leak | Mag | Carb | Cooling | Cool Rate | Charge | Finding |
|---|
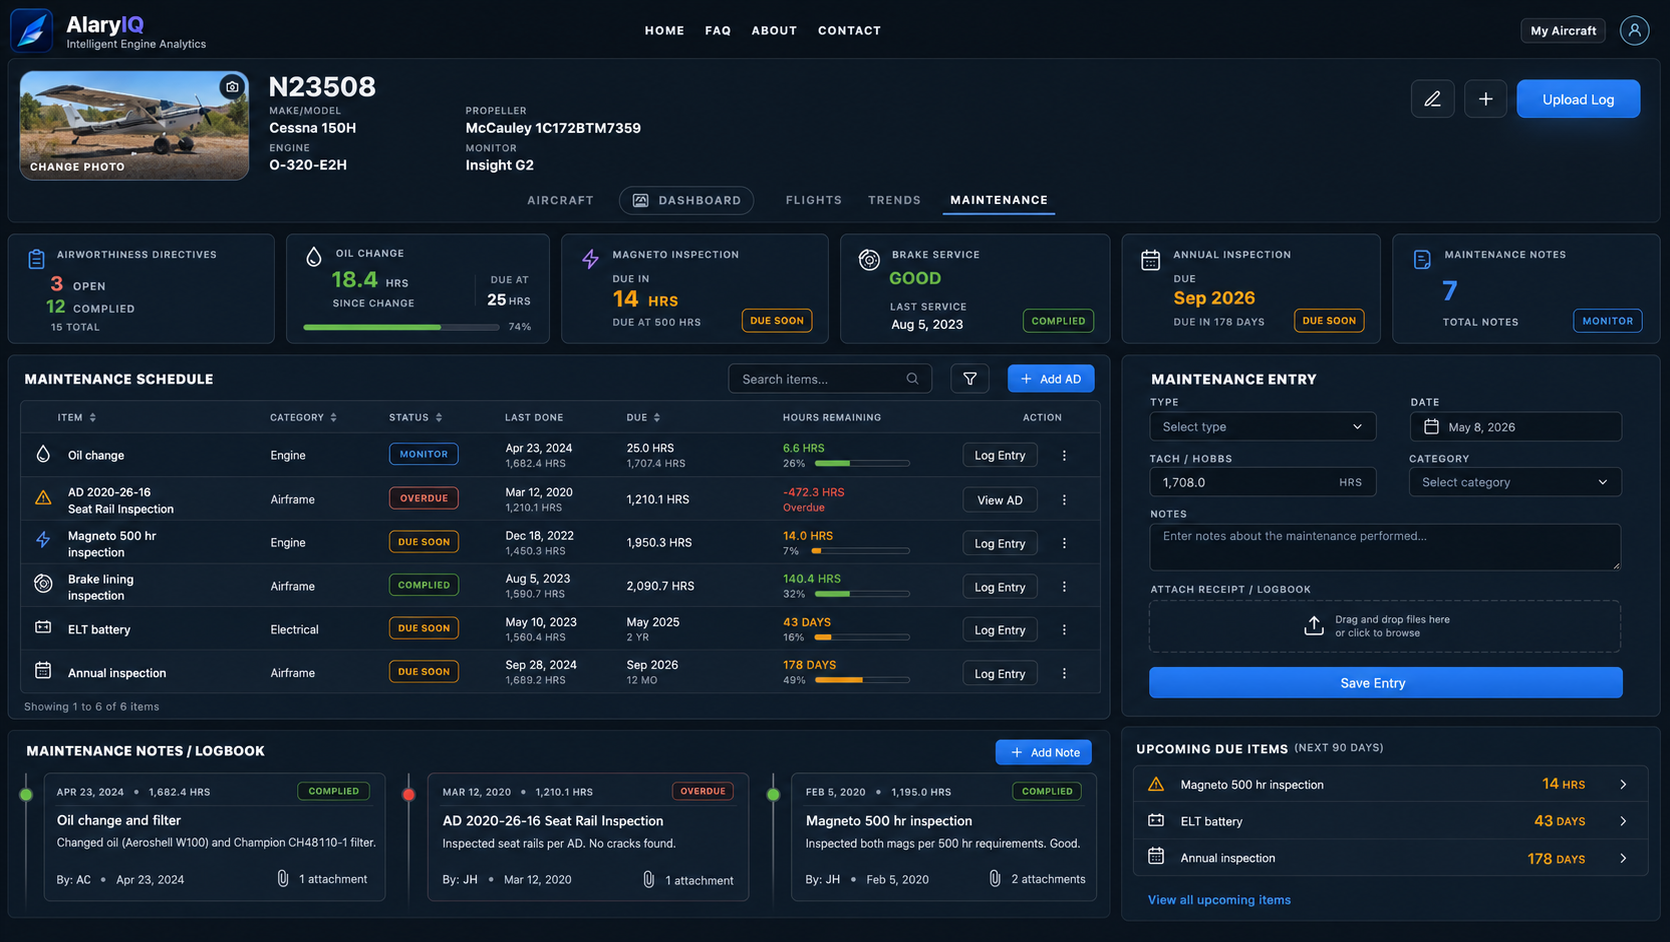
Maintenance tracking is being prepared for this aircraft workspace.
Account management is being built and will be ready soon.
Flight 1 Selected
KAVL to KRDU · Cruise phase · 45 min
Flight 2 Reference
KAVL to KCHO · Cruise phase · 45 min
Comparison Summary
Engine performance was similar overall. Notable differences appear in CHTs on cylinders #3 and #6 and EGT spread.
Engine RPM and Manifold Pressure
Workspace
The first build focuses on the report and comparison workflows. This area is ready for aircraft-level trends, symptom assistant, raw-file review, and operator note screens.